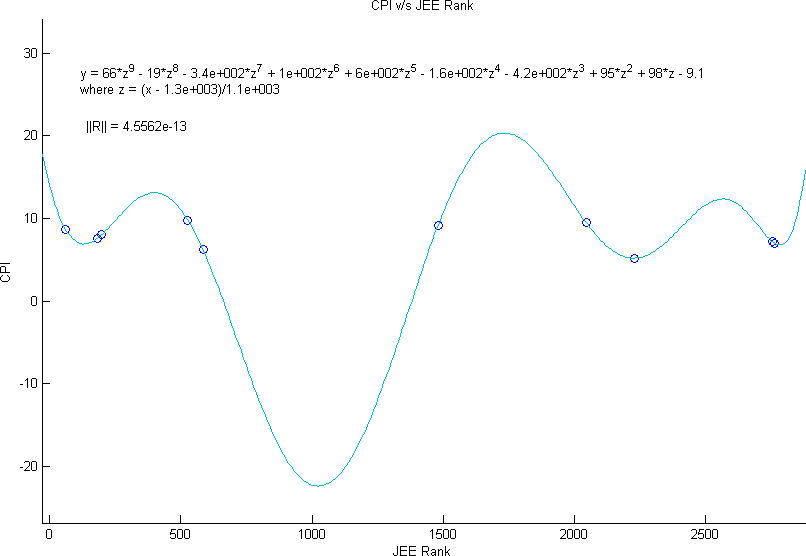
Note: Although for 9 points performing a 9th order fitting is erratical - I have used normalised variables which gives a unique possible solution although higly unfitting. Mathematically it is sound and fitting but there are many points where it is quite ill-conditioned and tries to simulate very large values as can be seen from the graph.
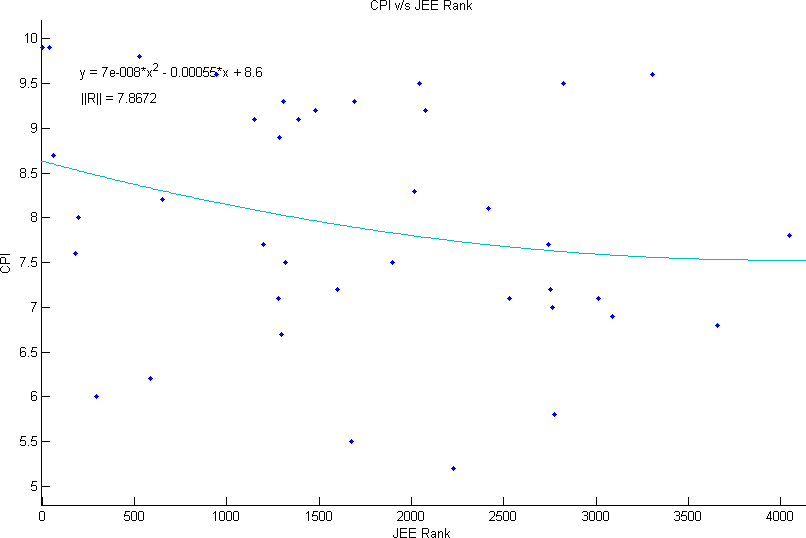
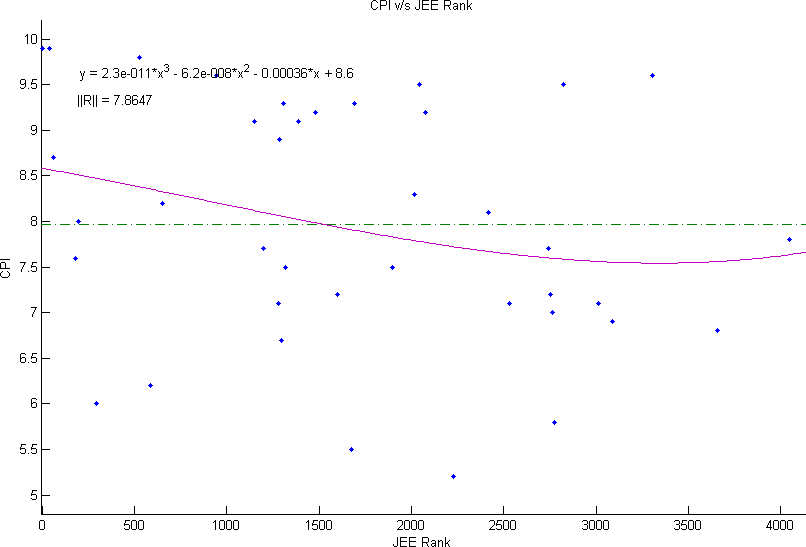
The residual errors for the bi-variate case are marginally lesser than the uni-variate cases (b) and (c) and the improvement is not significant to account for.
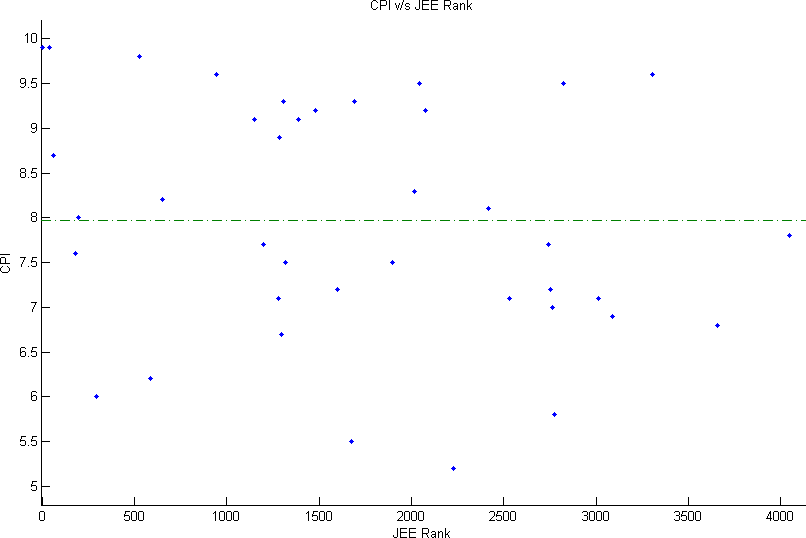
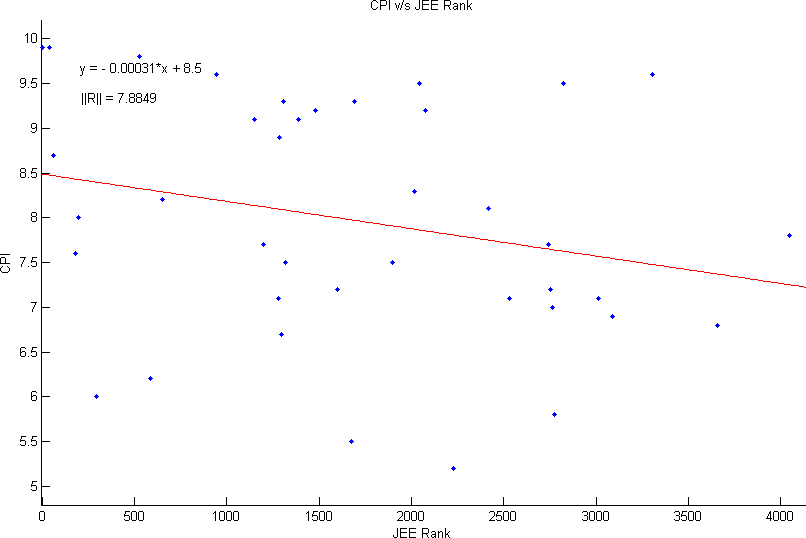
I would go for the linear-fit as it is computationally very simple and the residual errors are only slightly higher that the quadratic and cubic case. However, on the face of it, the data itself is very highly uncorrelated and no conclusive relation or function can be used to approximate it.
The coefficients tend to increase as the order of fit increases - their variations also increase. In the 9th order fit - coefficients go as high as 420.
| Coefficients | ||||||||||
| Order | Constant | x1 | x2 | x3 | x4 | x5 | x6 | x7 | x8 | x9 |
| 0 | 7.9 | |||||||||
| 1 | 8.5 | -0.00031 | ||||||||
| 2 | 8.6 | -0.00055 | 7e-8 | |||||||
| 3 | 8.6 | -0.00036 | -6.2e-8 | 2.3e-11 | ||||||
| 9 | -9.1 | 98 | 95 | -420 | -160 | 60 | 100 | -340 | -19 | 66 |
