Vedant Mishra (10792) Assignment 1
PART-A
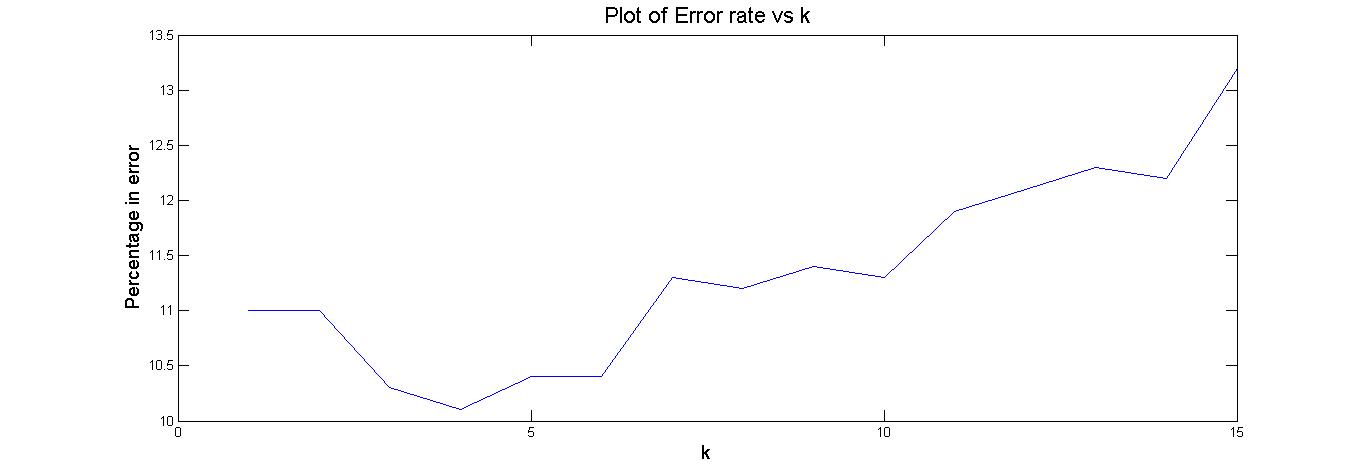
a)Plot of Error rate vs different value of k CODE
We observe that if k = 1, then the object is simply assigned the class of its nearest neighbour and hence the error is high as not much computation is done.
As we increase the value of k, the boundries between two different classes diminshes. Hence the error initially decreases (in our case till 4) and then increases.
Thus the value of k should be choosen as 4 so that the labels predicted for the test data matches with the actual data.
PART-B
In this assignment we used the MNIST dataset of numerals and with the help of Isomap ( which is a non linear dimentionality technique ), we created
manifold of this data using k-nn (k=5) from the data i.e. from the given data, a point was connected to its 5 neares points. Now in this manifold
distance between 2 points was calculated which is the mminimum path distance between any 2 points in the manifold (using Floyds Algorithm). Using Multi
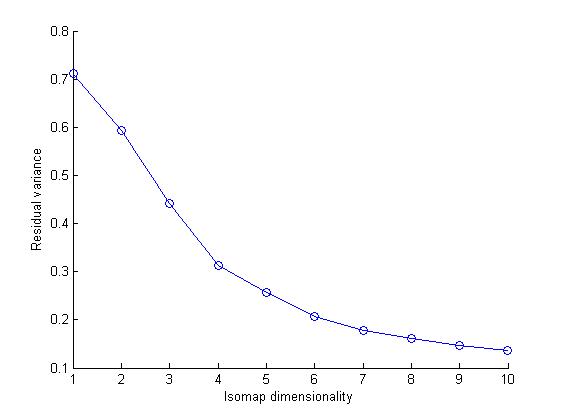
Dimensional Scaling we projected this manifold into low dimensional D which preserves the geodesic distance between the points in the manifold and we also
calculated the residual variance in this low dimensional subspace. Then we experimented with D (1:10) and plot the variation of residual variance with D.
From this curve we can estimate the intrensic dimensionality of the data.
B.1 -- 2-D Isomap model using Euclidean distance
a)Cluster- 1 and 7(1-green ,7-blue) (image)
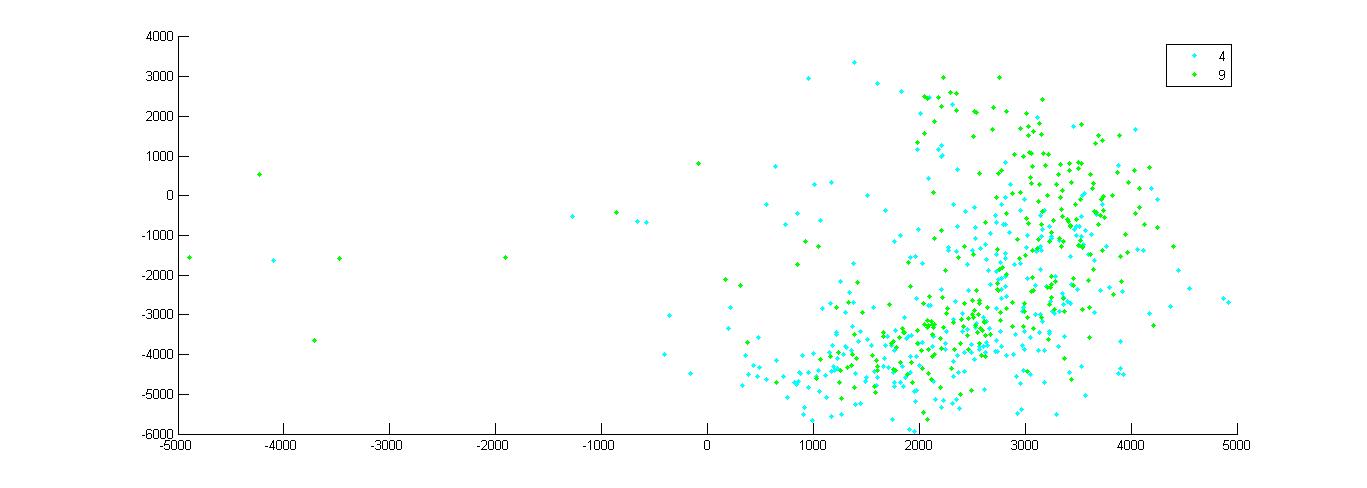
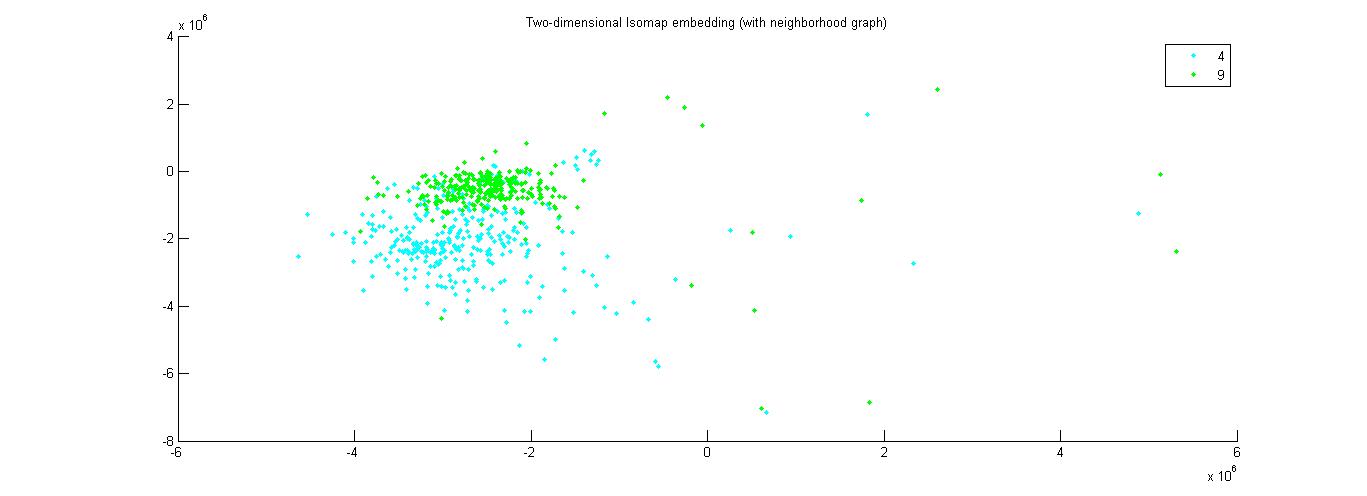
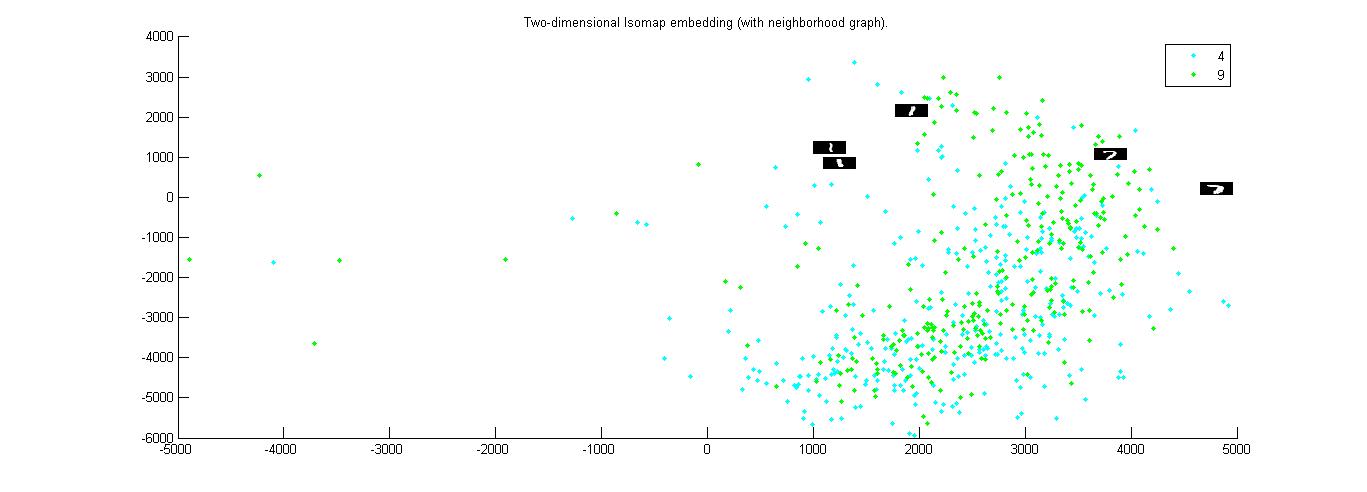
b)Cluster- 4 and 9(4-blue ,9-green) (image)
c)All digits (image)
Residual graph of 1 and 7 (image)
Residual graph of 4 and 9 (image)
B.2 -- 2-D Isomap model using Tangent distance
a)Cluster- 1 and 7(1-green ,7-blue) (image)
b)Cluster- 4 and 9(4-blue ,9-green) (image)
c)All digits (image)
Residual graph of 4 and 9 (image)
Residual graph of All digits (image)
Based on the graphs we observe that, the euclidean distance measure for modeling the 2D isomap is faster than the tangential one . But the 2D isomap model
obtained by tangential distance can distinguish the points in a better way as compared to the euclidean distance measure. Eg. in graph of 4-9 , clusters
are not seperable in case of euclideon distance but they are seperable when we consider the tangential distance.
Eg. consider cluster of 1 and 7 . As we go from bottom of the graph to top, the vertical line of the digits straightens or becomes more vertical.
As we move from left to right the convex curvature decreases and hence it becomes tends towards 1.
B.3 -- Extra Credit
a)Cluster- 1 and 7(1-green ,7-blue) using Euclidean distance(image)
a)Cluster- 1 and 7(1-green ,7-blue) using Tangential distance(image)
b)Cluster- 4 and 9(4-green ,9-blue) using Euclidean distance (image)
b)Cluster- 4 and 9(4-green ,9-blue) using Tangential distance (image)
c)All digits using Euclidean distance (image)
c)All digits using Tangential distance (image)
CODE Isomap.m
PART-C
| Epoch |
Learning rate |
Architechture |
Percentage of error(%) |
| 5 |
4 |
[100 75 200] |
4.02 |
| 15 |
15 |
[100 100 200] |
2.99 |
| 10 |
8 |
[200 150 200 150] |
too big error |
| 15 |
15 |
[100 100] |
2.56 |
| 45 |
25 |
[100 100] |
2.38 |
| 20 |
15 |
[75 75] |
too big error |
| 20 |
15 |
[100 100] |
2.7 |
| 5 |
3 |
[100 20 10] |
5.65 |
| 5 |
5 |
[100 100 75] |
3.78 |
As we increase the learning rate , the error rate decreases. As we have observed in the data percentage of error when learning rate = 4 is 4.02% and the error is
2.99 when the learning rate is 15. Also epoch value increases the error increases. The value of error doesn't change much after a saturated value of epoch.
We should not take very high value of epoch because it will cause overfitting of network.
RESOURCES
Isomap.m
L2_distance.m
tangent_d.m
loadDigits.m