Assignment 1
Part A : k-NN classifier
 Observations
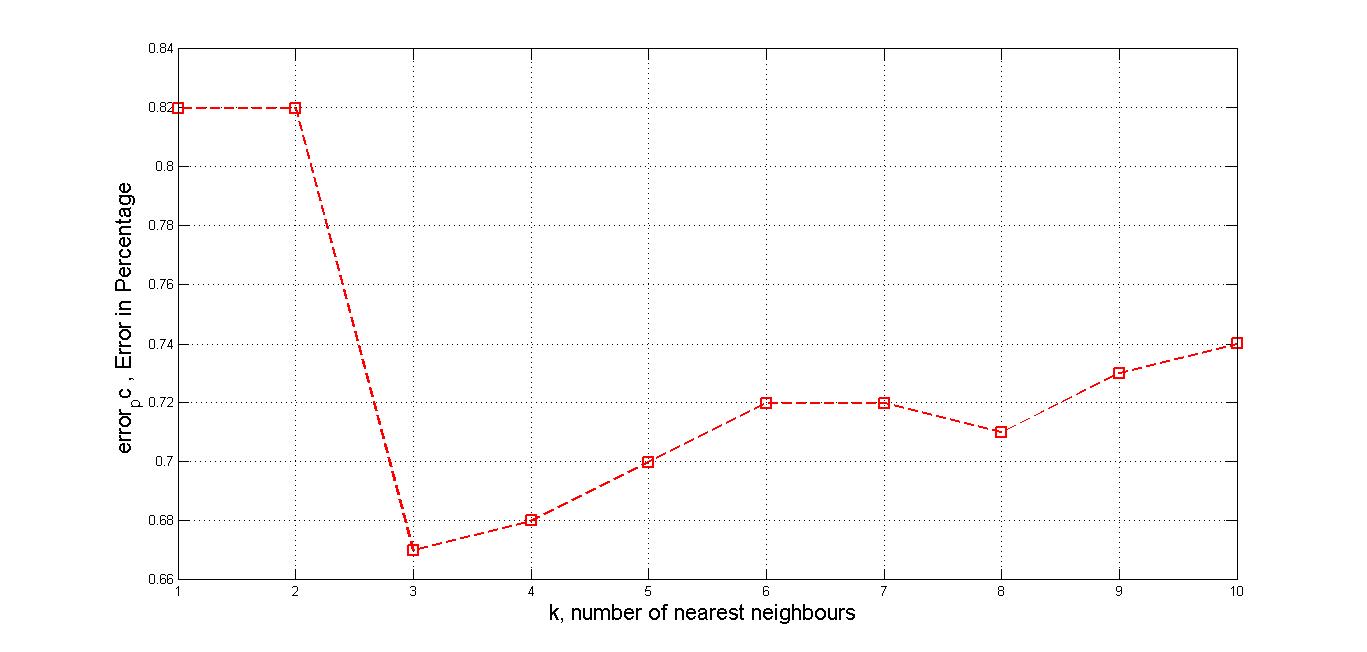
We see that the kNN classifier used for reducing dimensionality, gives different error values for different values of k.
The graph plotted with this, shows the variation of error percentage with value of k.
We observe that the graph gives higher error from k=1, reaches a minimum for the value of k=3, and then again increases for values >3.
The source code
Observations
We see that the kNN classifier used for reducing dimensionality, gives different error values for different values of k.
The graph plotted with this, shows the variation of error percentage with value of k.
We observe that the graph gives higher error from k=1, reaches a minimum for the value of k=3, and then again increases for values >3.
The source code
for kNN classifier.
Part B
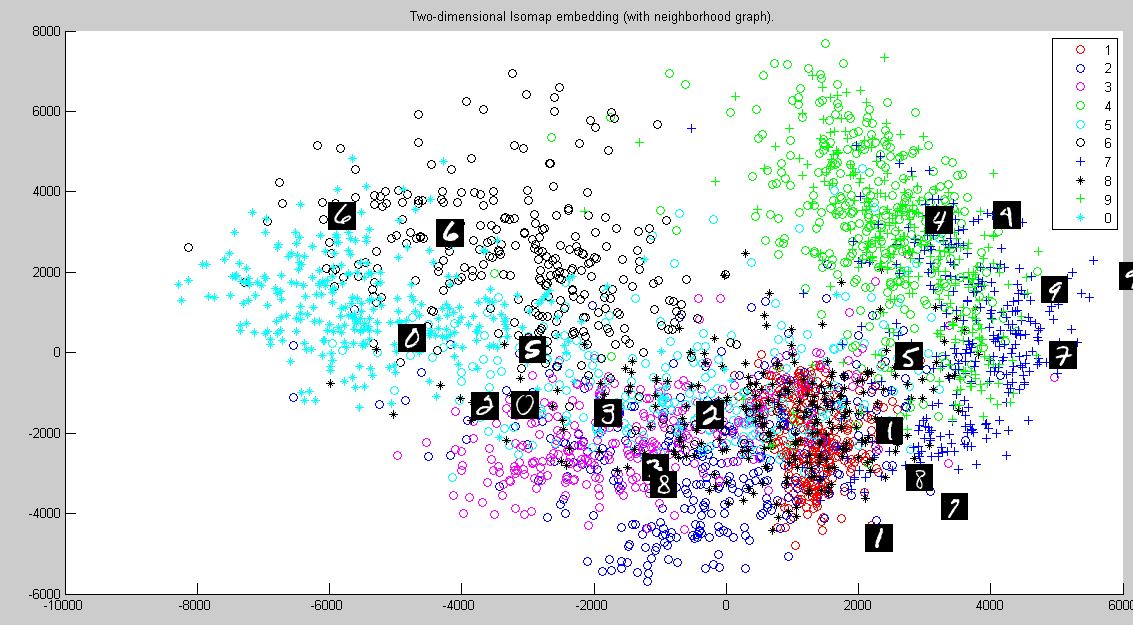
The isomap plotted by the two different methods identifies the different curves, and writing techniques, and implements learning, to identify different numbers.
In the plot of digits 1 and 7, the two numbers are clustered at different positions indicating that they are identified separately by their separate features. The handwritten numerals indicate which number is identified in which cluster.
1. 2-D isomap using Euclidean distance
1.a Digits 1 and 7

1.b Digits 4 and 9

1.c All digits

1.a 2-D isomap using Tangent distance
Digits 1 and 7

2.b Digits 4 and 9

2.c All digits


Part C
The Deep learning method uses different values of epoch, Learning rate, and batch size, giving different values of time and error percentage.
The trend noticed is that higher epoch value reduces error.
Higher Learning rate also reduces error, though by smaller margin.
The data having the table with different values is Data .
For the rest of the source code, for Part B, Q.1-2, the link is Download all code