Part1
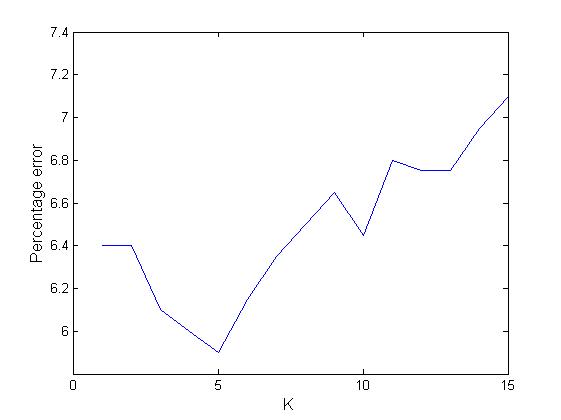
Graph with 'k' value on x-axis and 'percentage error on test set' on y-axis.
Train images:20000
Test Images:2000
K:1-50
Lowest error percentage at k=5
Observations
From the graph of 'k' versus 'percentage error on test set' we notice that the percentage error first decreases with increase in k value.But the graph takes a turn at k=4 and then percentage error increases with further increase in 'k'. This behaviour can be as expected because when k=1,2,3 then we cannot classify a data element based on too few neighbours. But after k=4 the value increases since in that domain we get sufficient points from all the digit classes and thus cannot associate the data element to its corrent class.
Part2
Eucliedean Distance Used
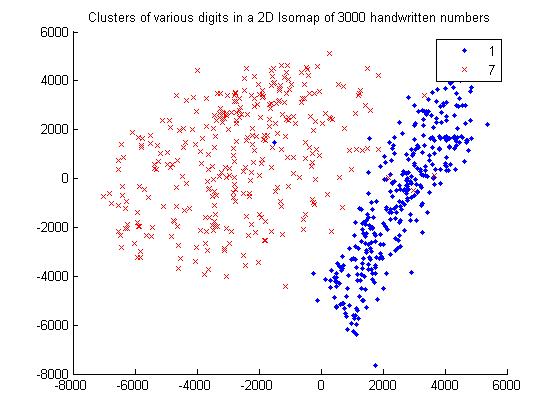
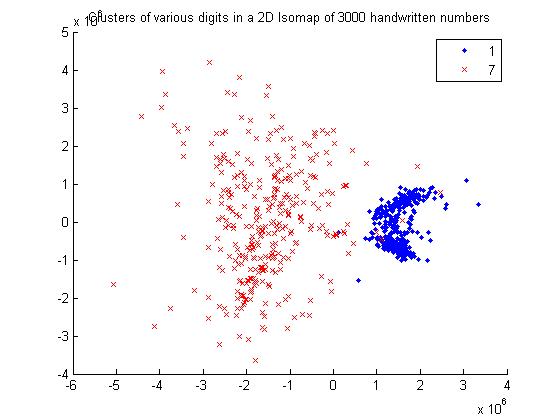
For 1 and 7
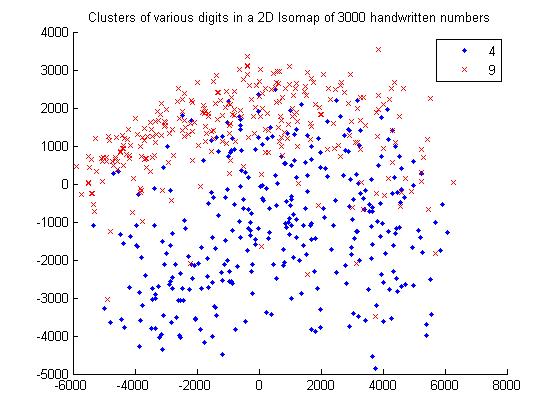
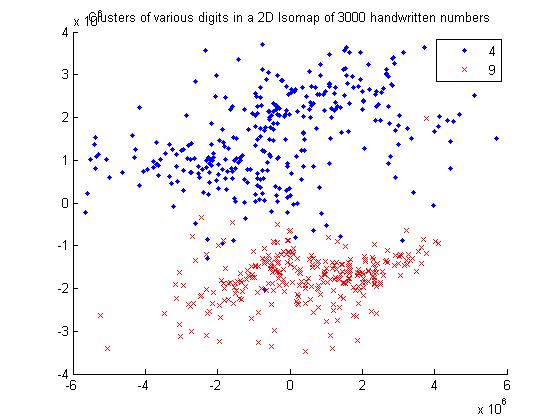
For 4 and 9
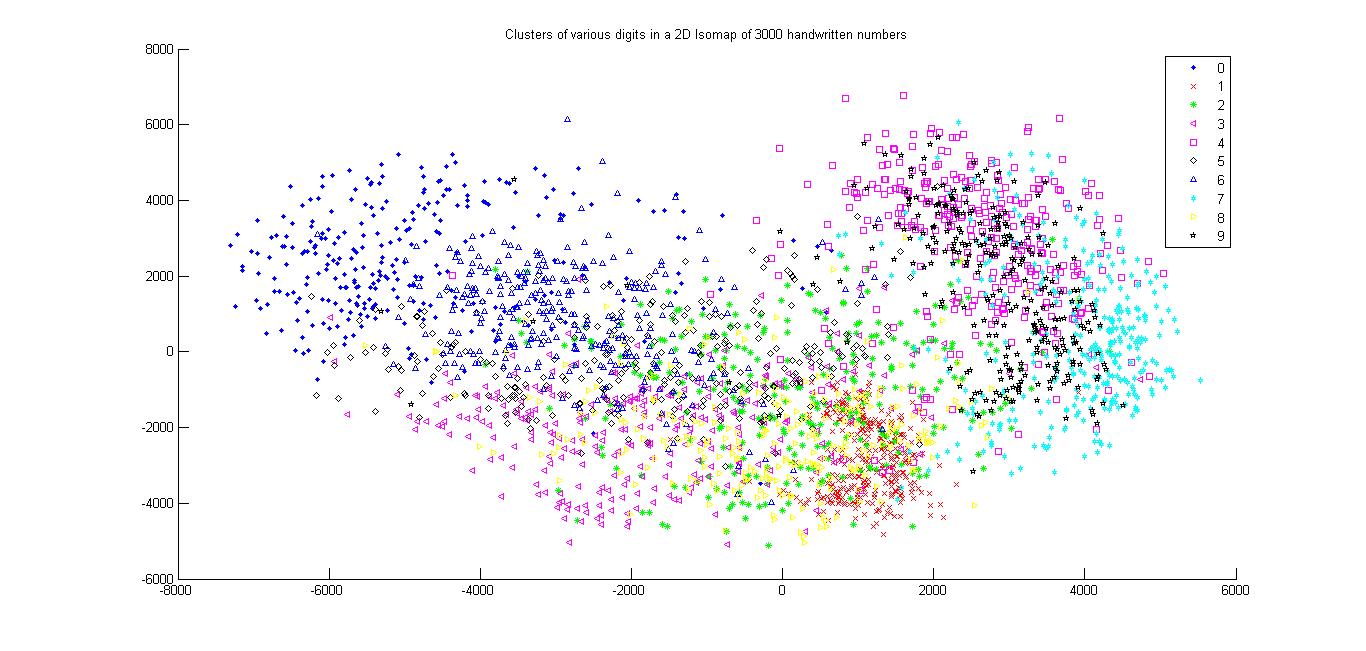
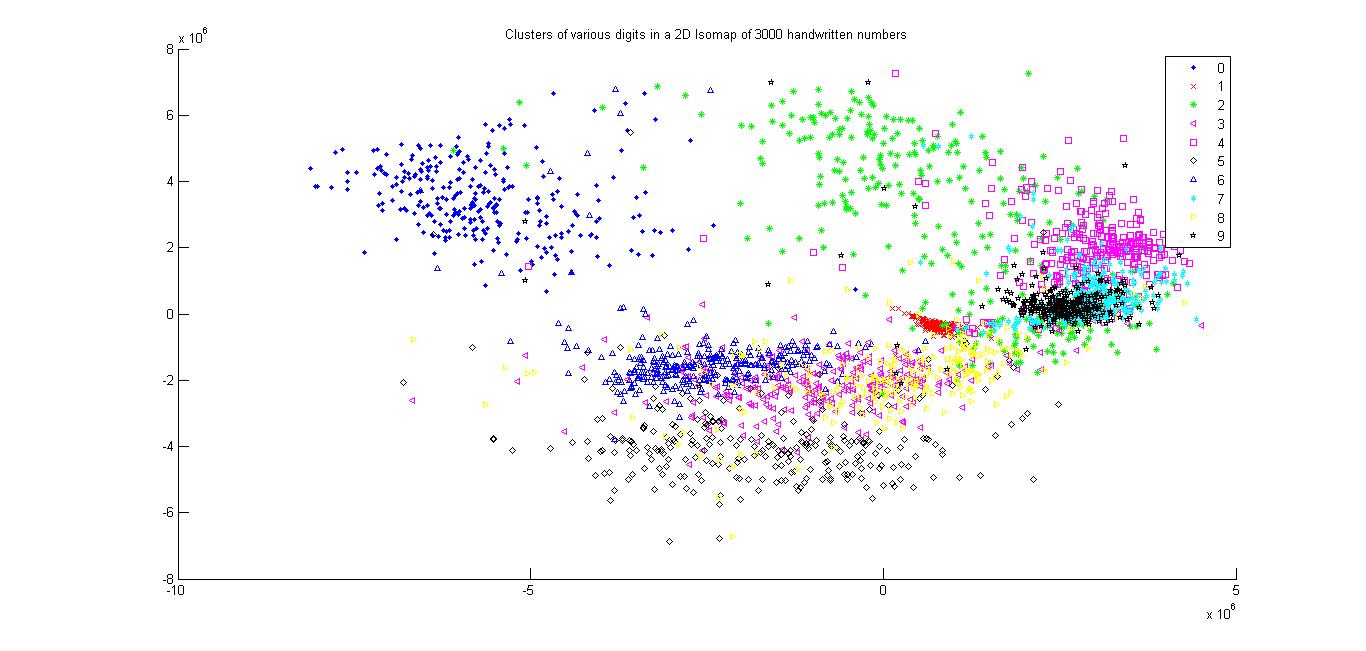
All the digits
Tangent Distance Used
For 1 and 7
For 4 and 9
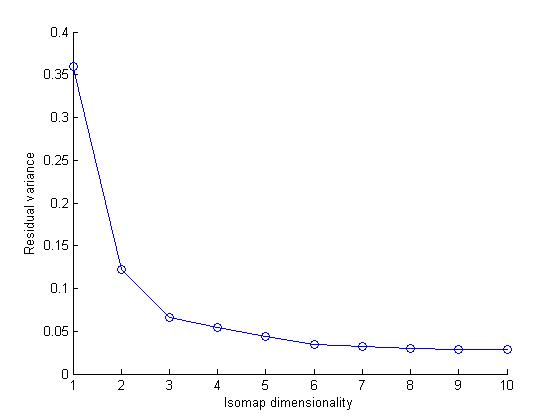
All the digits
Extra
Using Euclidean Distance
Using Tangent Distance
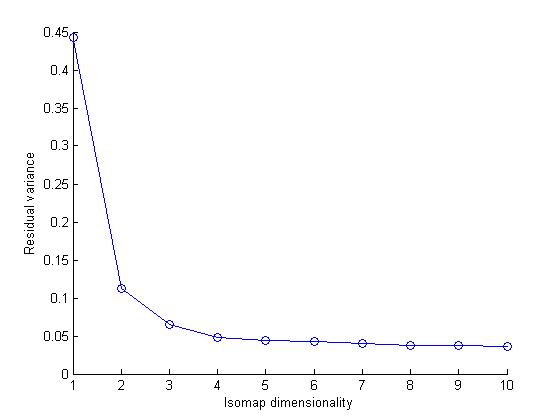
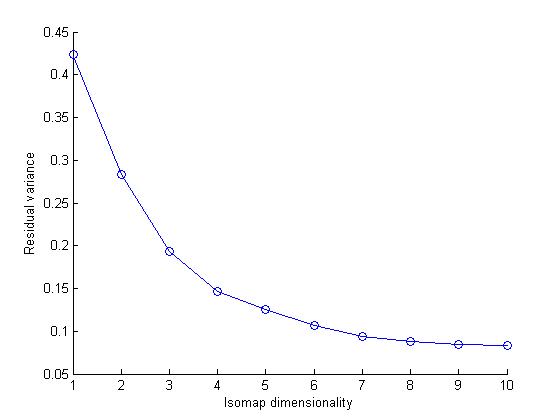
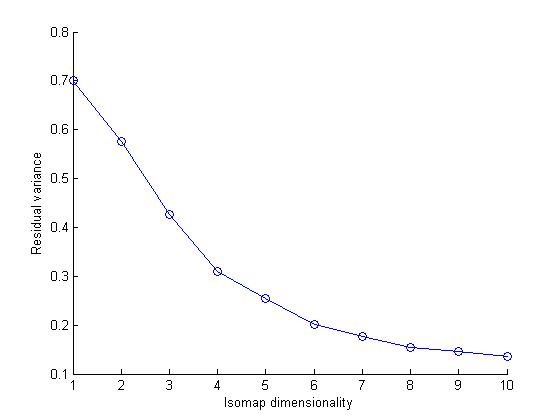
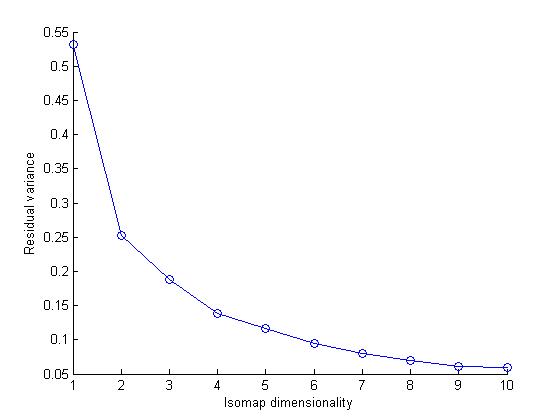
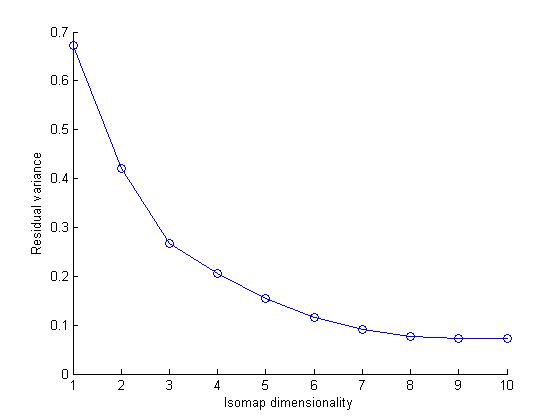
Brief Isomap
Isomap computes a low-dimensional embedding of a set of high-dimensional data points. The algorithm used in isomap provides a simple method for estimating the underlying geometry of a data manifold based on a rough estimate of each data points neighbors on the manifold.We can use different distance metric while computing an Isomap model of a dataset.In this assignment we user Eucledian and Tangent Distance metrics.
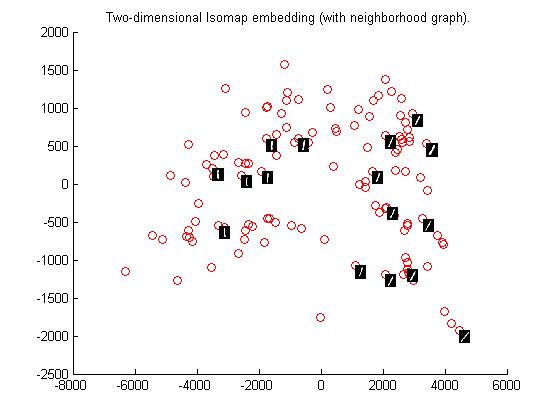
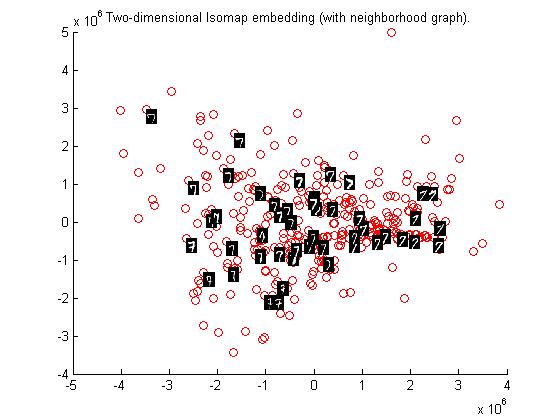
Observations based on graphs
I noticed that the data set cluster becomes more dense as we change the distance metric from Eucledian to Tangetial.This is because the eucledian metric classifies a data point naively on the bases of sum of squares of pixel to pixel distance whereas tangent metric also considers the various rotational transformations of pixels.Clearly considering these transformations makes sens
e in case of
our dataset as handwritten numbers may be tilted or rotated. Therefore tangent distance metric is more accurate for clustering datasets of this kind.
Part3
DBN with NN initialized using weights of DBN
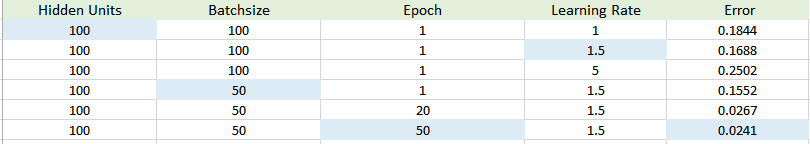
Procedure of the experiment i.e working of deep architectures.
In deep learning learning is done in several phases.Each phase uses the information deduced from previous phases,thereby improving the classification or the representation of various features in each phase. Multiple levels of latent variables allow sharing of statistical strength.In deep learning the learning time and % error of the model depends on layer architectures and various parameters such as learning rate, epoch etc.We need to vary the parameters considering the results obtaines in the previous phases.Continuing this process we will finally reach the minimum error state eventually.
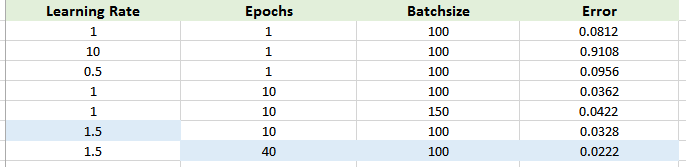
Observations based on the above table.
With increase in number of epochs(keeping other parameters same) the percentage error decreases but the time taken to perform the experiment increases. With increase in learning rate(keeping other parameters same) the percentage error increases but the time taken to perform the experiment decreases. Therefore, keeping the learning rate =1 and degree of network =2 and increasing the number of epochs could provide good results with decreasing error percentage Minimal Error is marked.(it follows the specifications of above point)