Homework 1
Submission By: Akshay Agrawal
(10058)
Matlab Codes(.m files)
1.) K-nn Classifier
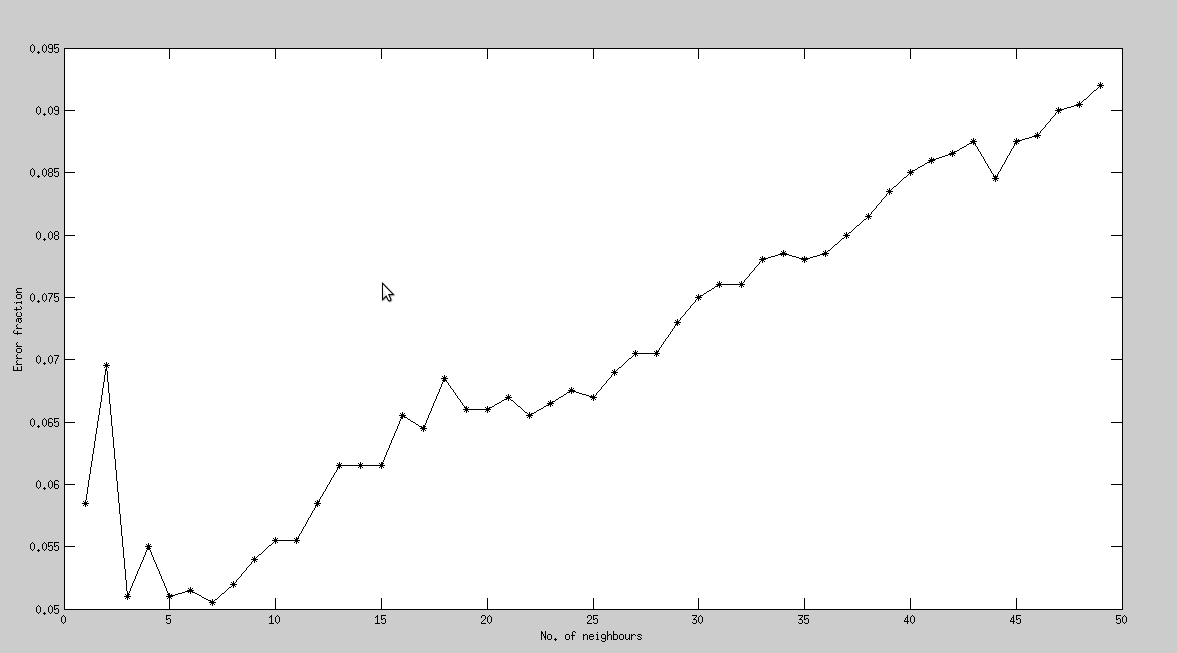
k(the number of neighbours) ranges from 1 to 49
For a Training set of size 12000, and a Test set of size 2000,
least error in prediction of label is obtained while considering only 7 closest neighbours.
Error Fraction(k=7) : 0.0505
(Error fraction)
2.) Constructing 2-d Isomap and ploting the clusters of some combination of digits
2a. Using Eucledian Distance
Isomap is a method used to map a high dimensional data to a proporionate lower dimensional space.
The algorithm however requires distance of all the points in this high dimension space from every other point,
and thus the distance matrix(D) is determined by using either the eucledian distance or the tangential distance.
Closest neighbours can be determined from the information contained in D, by using any one of Dijkstra's or Bellman Ford Algorithm's.
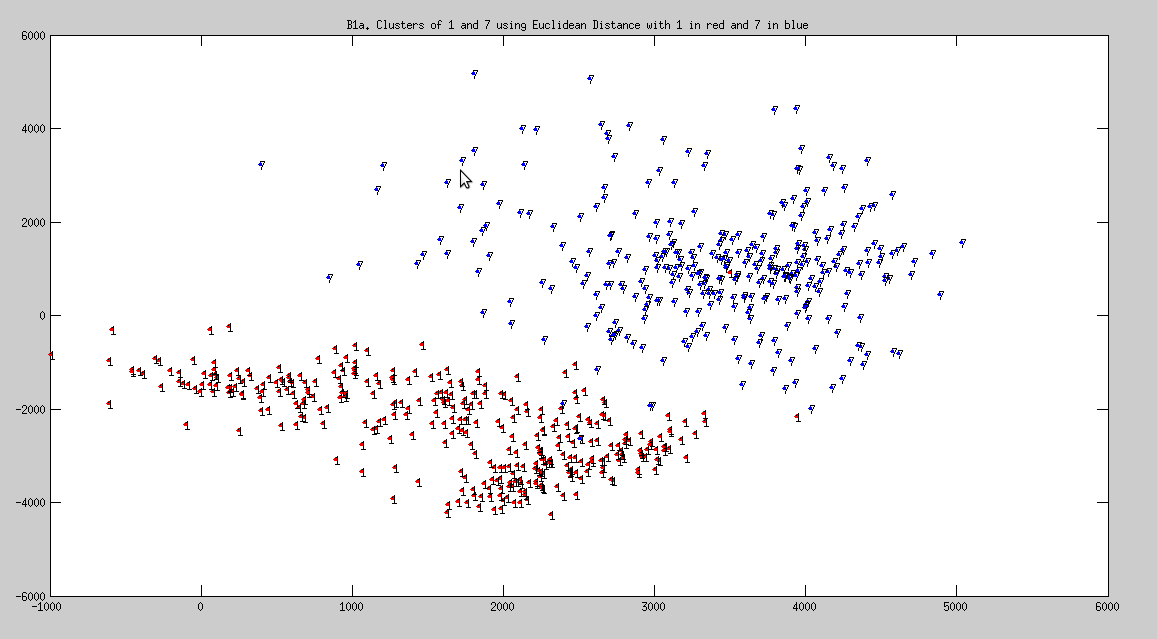
Cluster of 1 and 7

Cluster of 4 and 9
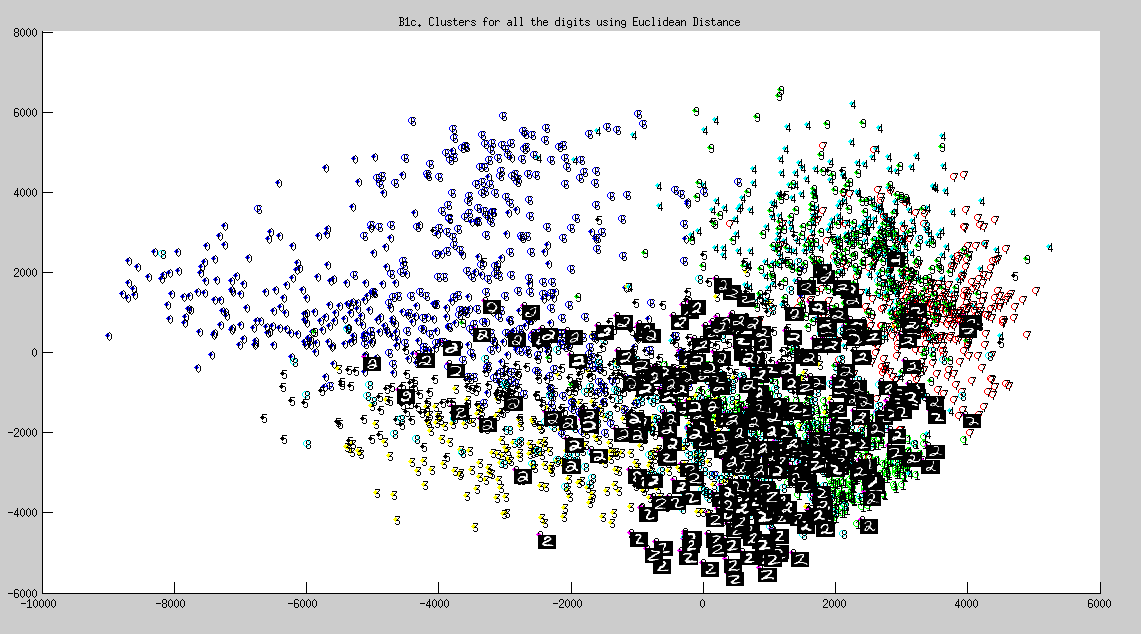
Cluster of all digits from 0-9
Note:
- Some images(of number 2) is displayed in set of clusters of all digits(fig. 3), as asked in the assignment(for extra credits)
- Plots are generated using eucledian distance(obtained from L2_Distance.m)
- Observation: 1 and 7 are found distinctly seperated, but such a boundary is missing between 4 and 9. This implies that 4 and 9 are almost identical.
2b. Using Tangential Distance
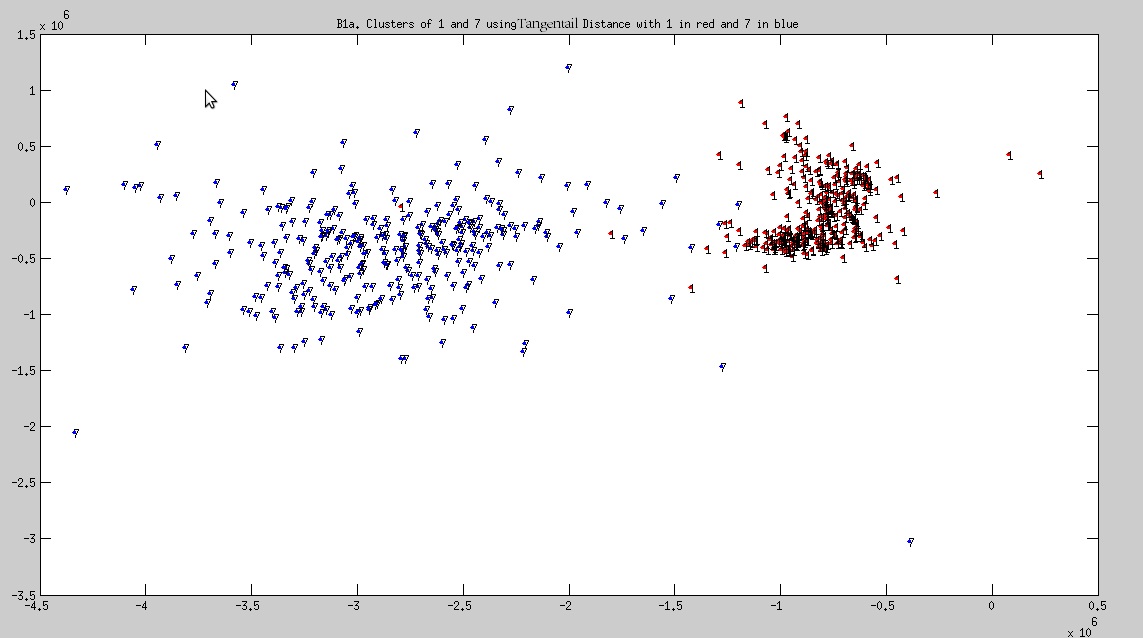
Cluster of 1 and 7
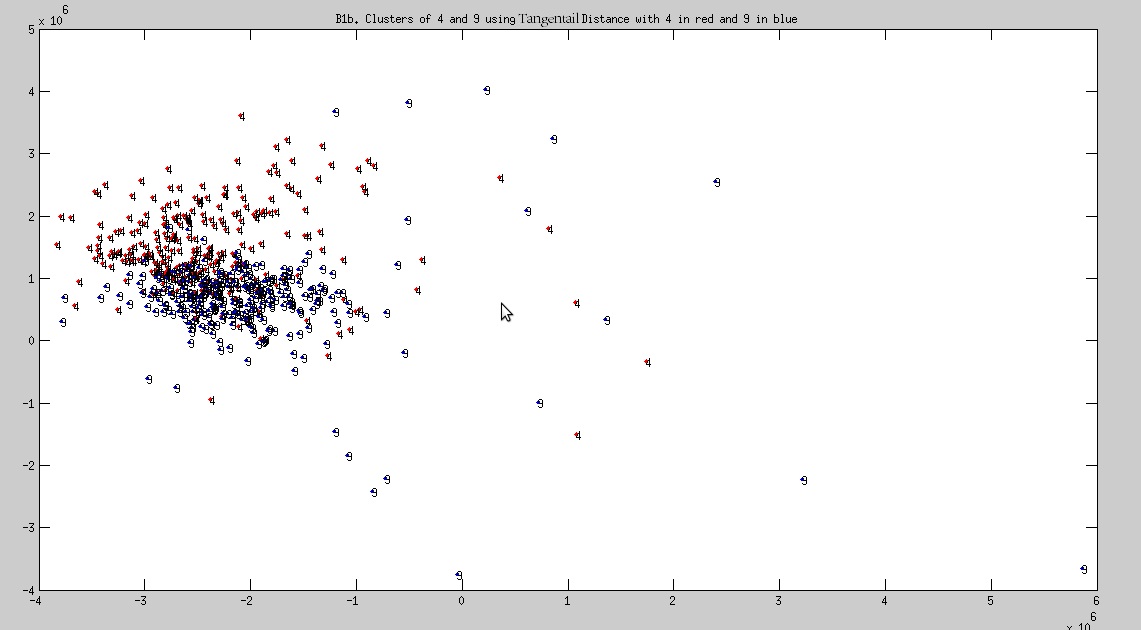
Cluster of 4 and 9
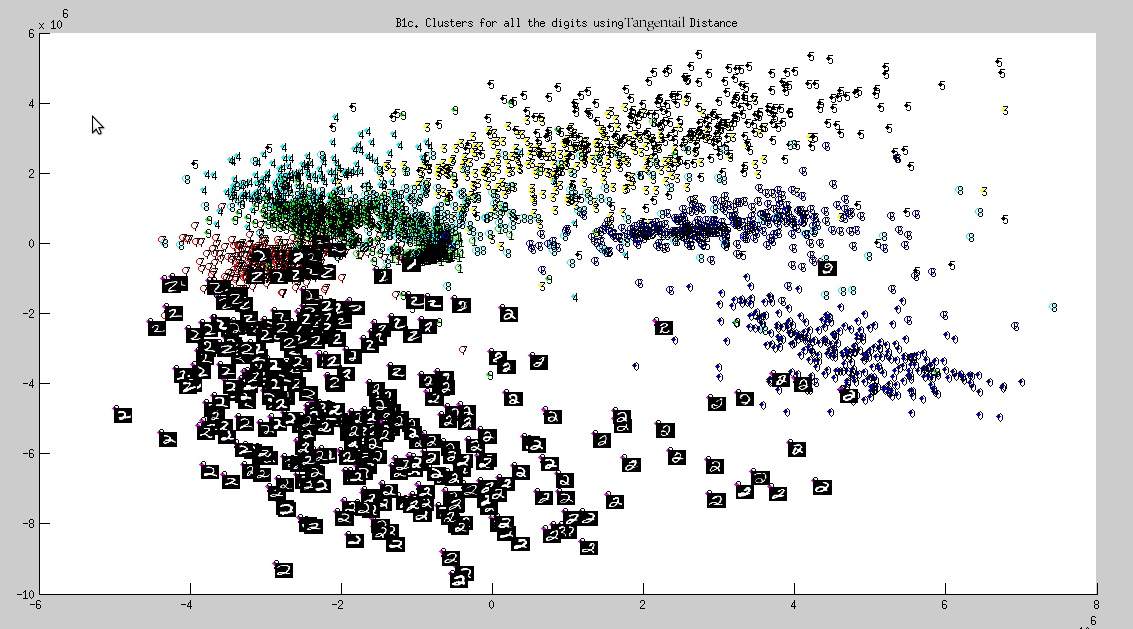
Cluster of all digits from 0-9
Note:
- Some images(of number 2) is displayed in set of clusters of all digits(fig. 3), as asked in the assignment(for extra credits)
- Plots are generated using tangential distance(obtained from tangent_d.m)
- Observation: 1 and 7 are found distinctly seperated, but such a boundary is missing between 4 and 9. This implies that 4 and 9 are almost identical.
3.) Deep Learning
Deep learning algorithm uses many examples of natural images to discover good representations of them.
A classification model is constructed by tuning the weight functions so as to minimize the error,
('alpha' and 'momentum' gets modified internally in each iteration to reduce the error) on the supervised data set (images with appropriate labels).
Later this model is used to determine the labels of any random test image.
And hence the percentage accuracy of the model is determined.
DBN-NN parameters vs Error fraction report can be found at this link.
Tests by changing the parameters of DBN layer architecture were performed only on "test_example_dbn.m"
Observation:
- Increasing the number of iterations(epoch) decreases the error
- Error fraction declined at a faster rate when epoch number of NN is increased, as compared to that of DBN
- Increase in the number of layers does not neccesarily guarantee a decrease in error fraction, it however certainly increases the total time of execution.