Anurag Pandey 10137
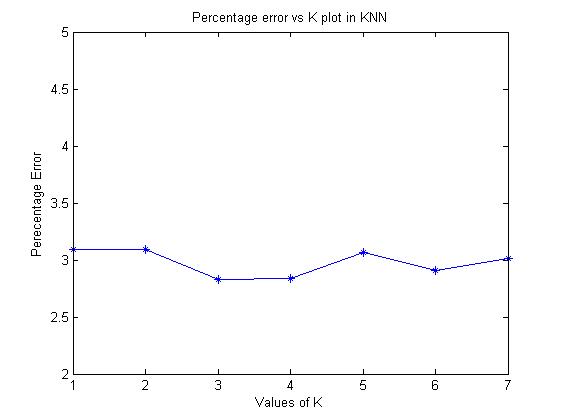
As shown in the above plot, we conclude that for k = 3, we get the minimum error rate. Increasing K further doesn't help much. May be the conflicting type of neighbours are responsible for this and the conflict remains even when we increase the number of nearest neighbours.
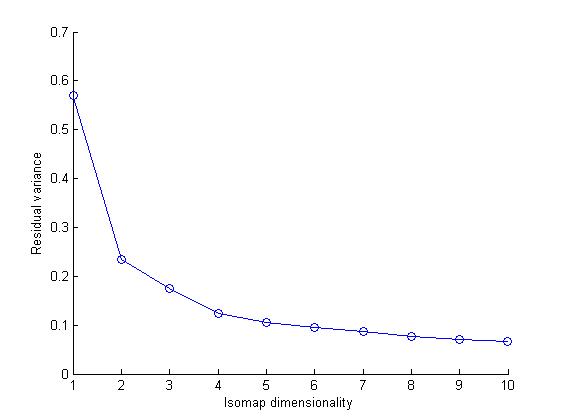
Isomap is a dimensionality reduction technique where geodesic distances on a weighted graph are incorporated with the classical scaling (metric multidimensional scaling). It performs low-dimensional embedding based on eiher the pairwise distance between data points, which is generally measured using straight-line Euclidean distance or the tangent distances between the data points
(i) Cluster plot for Digits '1' and '7' -
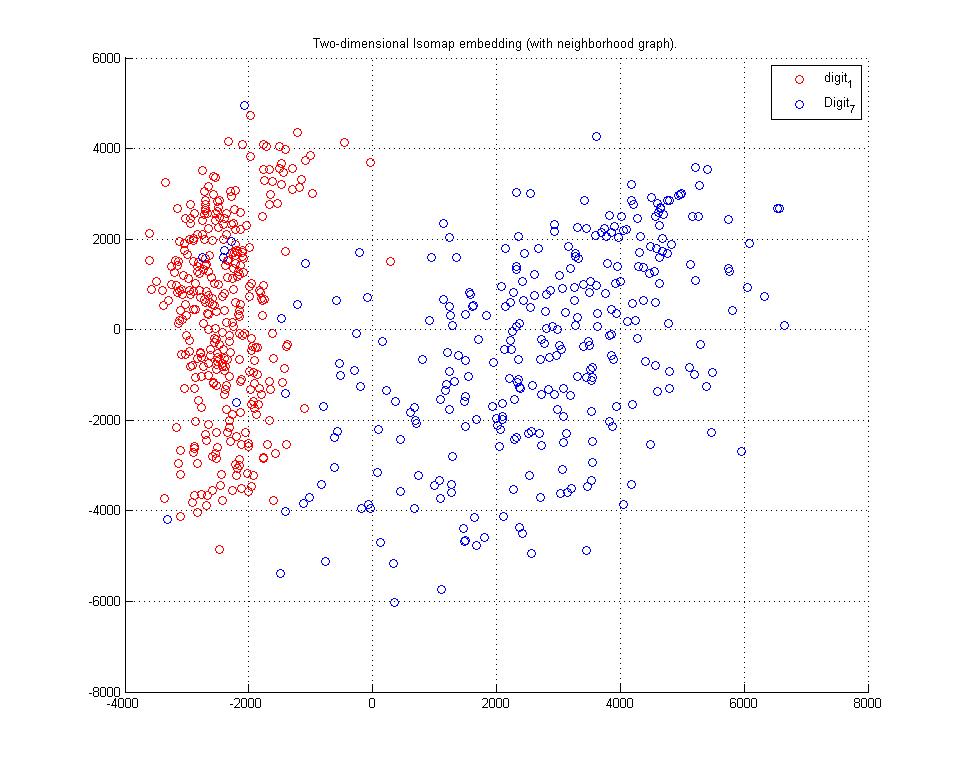

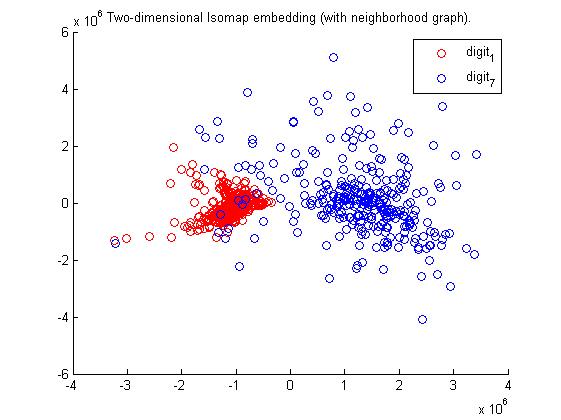

Clearly Tangent Distances yield better clustering over L2 Distance. Resudal plot also shows Tangent Distance gives better clustering results.
(ii) Cluster plot for Digits '4' and '9' -
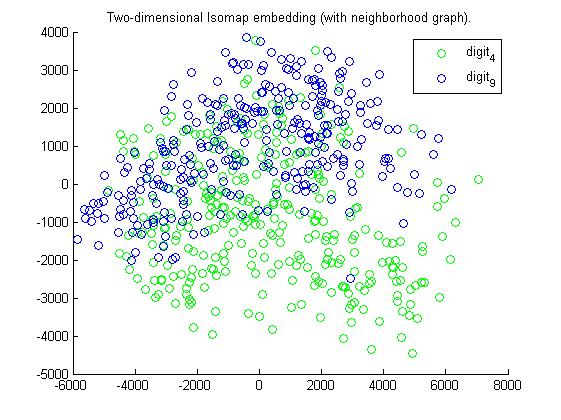


Clearly here too Tangent Distances yield better clustering.
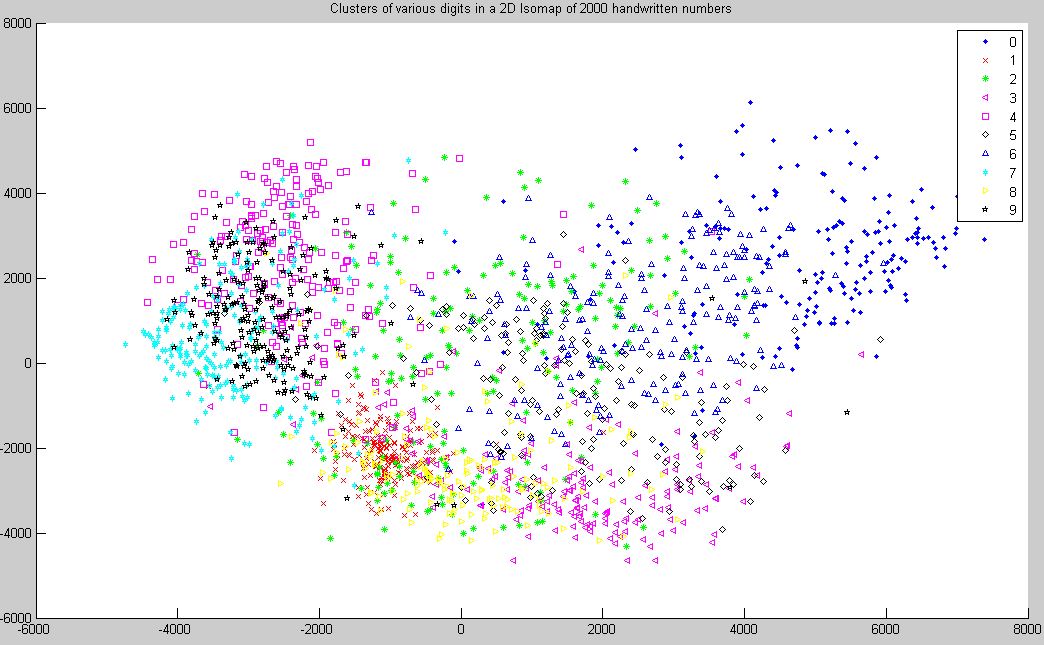
(iii) Cluster plot for all Digits -
Deep Architectures use input data sets as training examples and discover good features to represent them, thus using the knowledge extracted from unlabeled data effectively. These are advanced form of neural network which uses greedy layerwise procedure for training using gibbs theory of sampling. It is a form of unsupervised learning in which higher order features are learned.
These are the test cases that were taken into account.
A.
Architecture used : [200 137 200]
No. of Epochs = 20
Learning Rate = 0.8 to 1.4
Best Case Error Rate = 2.64 corresponding to learning rate 1.4
Time of Running Code ~ 5.5 minutes