Homework3
Part A
Scree Plot(using PCA)

Using Residual Variance

Description: From the graph the most likely dimension for the isomap is at 2 as there is a sharp peak occuring at dimensionality 2. This is because
the robotic arm with two hands has 2 degrees of freedom, one each. So the isomap can reduce the dimensionality of the manifold successfully at a
dimension of 2 such that dimensionality is equal to the number of degrees of freedom.
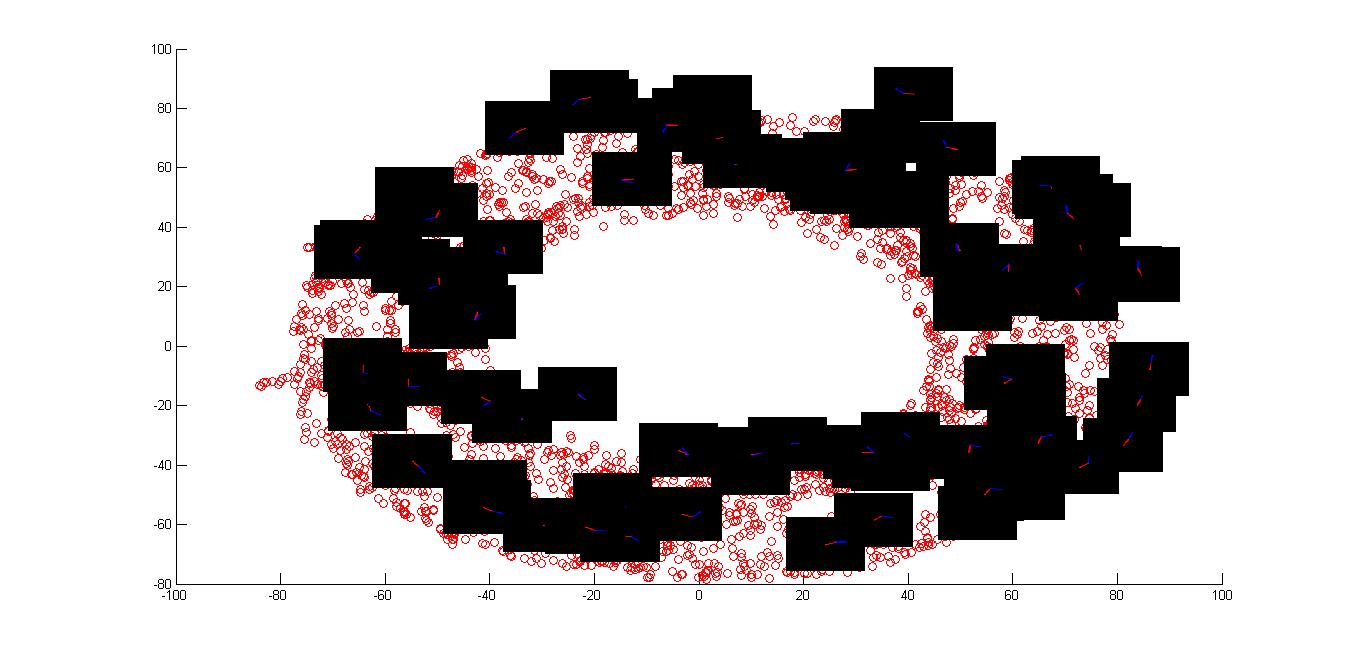
Part B
Part C

Description:
Variation of theta1: From the isomap created in partB, we can clearly say that by taking the center of the plot
as the centre and if we move along the ellipse at a paticular radius r, the angle made by the red hand with the horizontal(theta1) increases gradually
and varies from 0 to 360 degrees.
Vaiation of theta2:From the isomap created in partC, if we fix theta1, and move in radial direction, then angle made by the green hand with
the red hand (theta2) varies from -180 to +180 degrees.
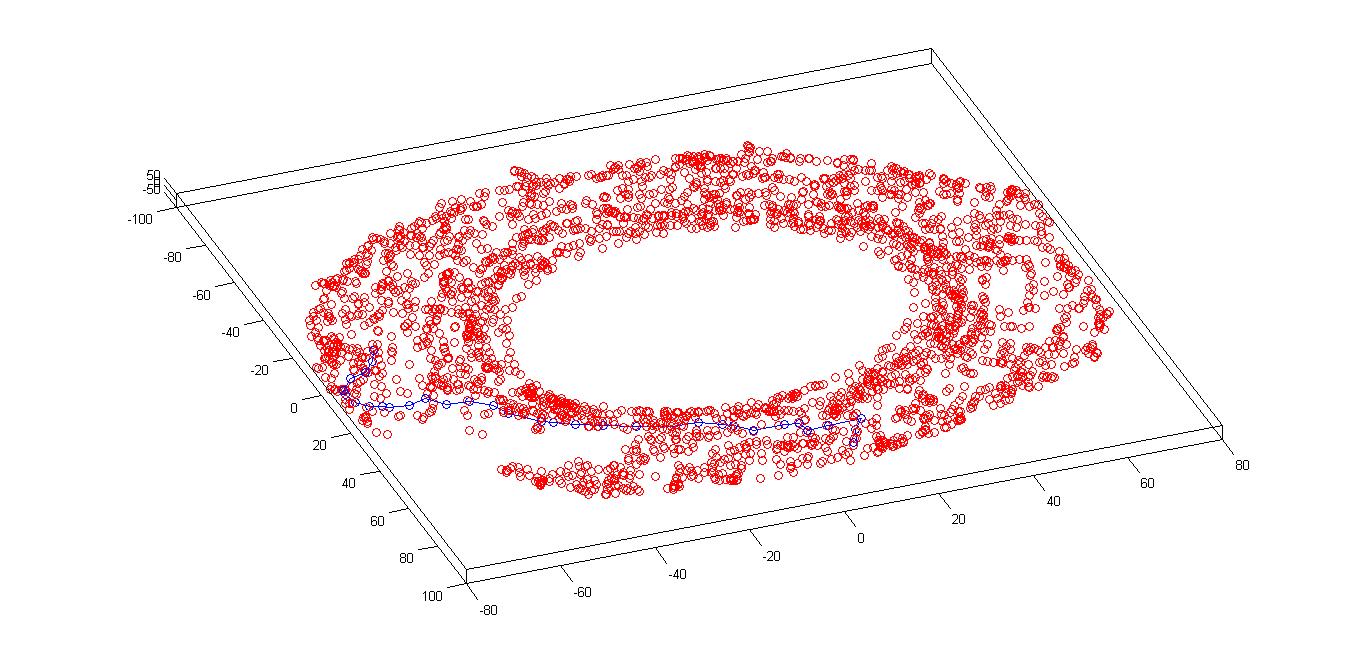
Part D
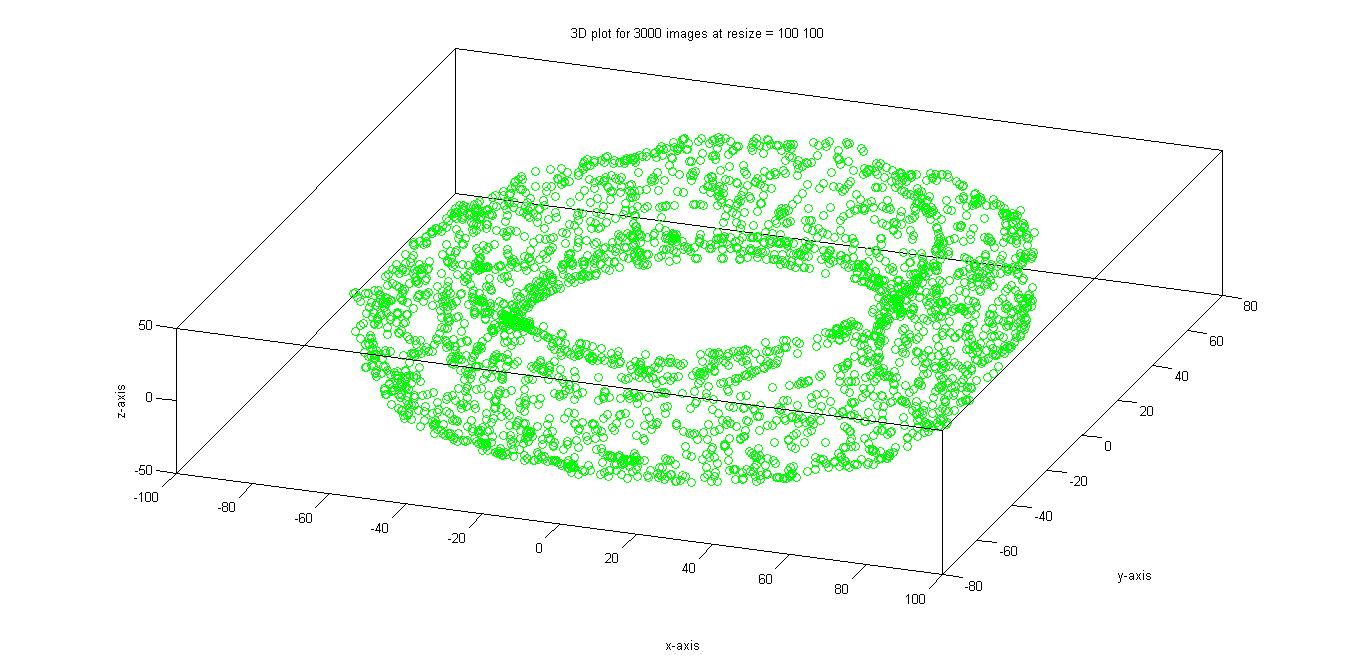
Description:
From the 3-D isomap created, we can observe that the topology created is a torus.
Part E


Description:
From the above plots we can observe that learning the map from 2D parameters for the robot converges faster than using
control parameters. This is because number of input variables in the first case is 2 and in the second case, it is 4. So it takes lesser time
by using 2D parameters.
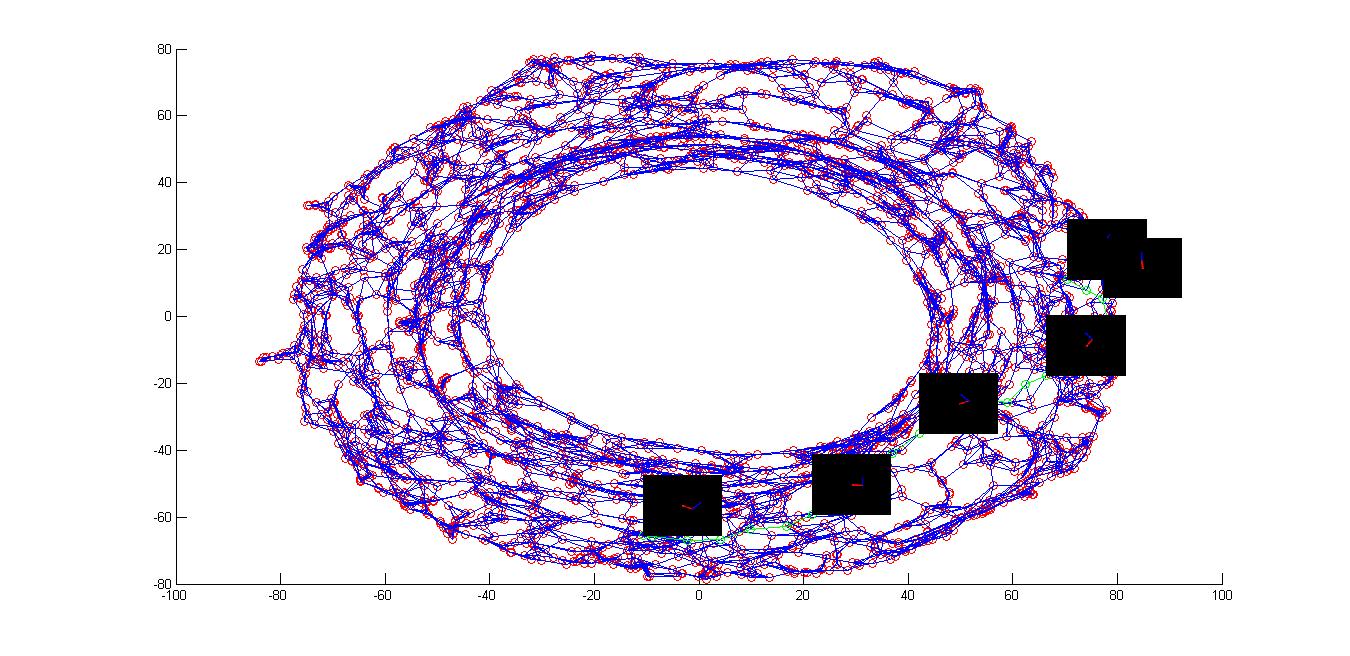
Part F
Description:
Green line shows the shortest path between the Source and the Goal images. Some missing part is seen due to the
obstacle.
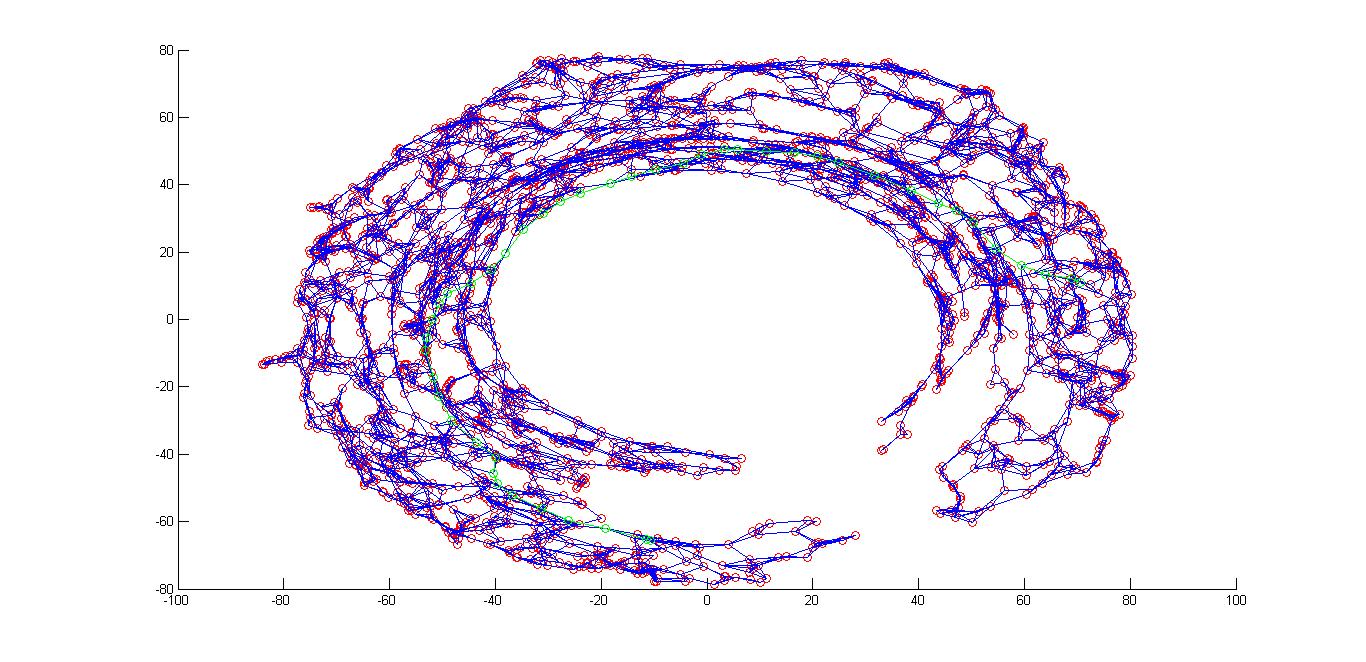
Part G
Description:
Blue line shows the shortest path between the Source and the Goal images. Some missing part or cut is seen due to the
obstacle.
Source Code