CS 365 Assignment 1
Jitendra Kumar Dhakar
Part A. k-NN based classifier
Observations About k-NN based classifier.
Here i have used data set of 6000 points and and a set of 2000 points as test set . Here in graph we can see that in case of k = 2 we are having large
error that is because of not considering the case of two not with same count for any k . We can also see that error is increasing with increasing k value.
On x-axis it is k values and y-axis it is error%.
- Graph for error with k values
Part B.1 2-D isomap model using euclidean distance
Brief About Isomap.
Isomap is an low dimensional embedding method where we handle high dimensional data set and embed the data points on a low dimensional
space and calculate the residual variance,which gives me an idea how bad we failed to embed.This tries to calculate the geodesic distance on a low dimensional
manifold by guesing the neighbourhood using the k-NN approach and then using djikstras algorithm to calculate the geodesic distance between 2 given points and then
using these formula to calculate the points in these subspace.Here we are trying to reduce the dimentioanality of data space ,and that will make our further calculations less comlex.
And we are simultaneousaly trying to coverage of data set in our calculations so that dimensionality reduction will be less affected.
- Isomap for digits 1 and 7 using euclidean distance
- Residual variance curve for digits 1 and 7
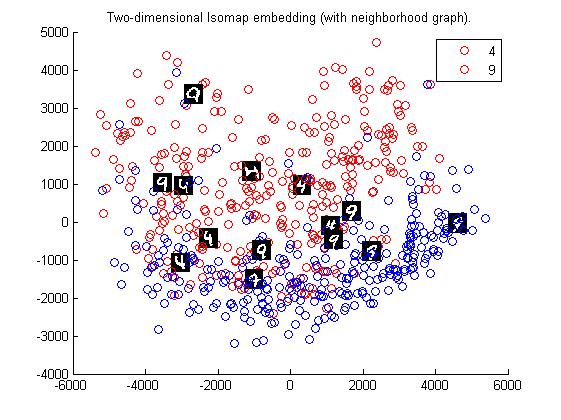
- Isomap for digits 4 and 9 using euclidean distance
- Residual variance curve for digits 4 and 9
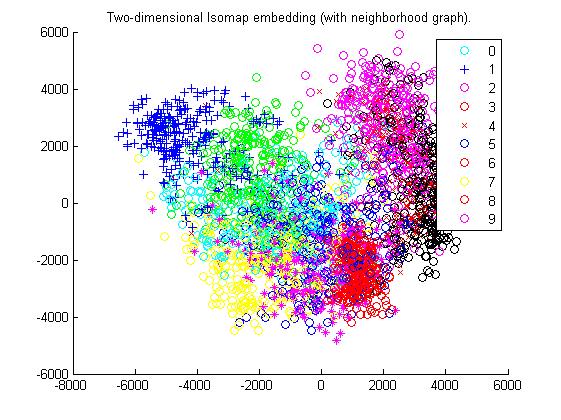
- Isomap for All digits using euclidean distance
- Residual variance curve for All digits
- The digits are shown on maps, as in the Tenenbaum's paper.
Part B.2 2-D isomap model using tangent-distance
- Isomap for digits 1 and 7 using tangent-distance
- Residual variance curve for digits 1 and 7
- Isomap for digits 4 and 9 using tangent-distance
- Residual variance curve for digits 4 and 9
- Isomap for All digits using tangent-distance
- Residual variance curve for All digits
- The digits are shown on maps, as in the Tenenbaum's paper.
Observation About Deep learning.
1 and 7 are well separated in both graphs but 4 and 9 are not . And also the observation in tangent distance
tells that separation is batter in tangent distance than in euclidean distance.
Part C. Deep learning
Brief About Deep learning.
The goal of deep learning is to explore how computers can take advantage of data to develop features and representations appropriate for complex interpretation tasks .
Observations
Increasing no. of epochs decreases the error of DBN. No variation with alpha. At some point of time increasing the no. of layers in network may be useful .
Optimum value for %error is 3.78.
- Graph for deep learning