Anant Raj 10086
Link for all the codes is given below.
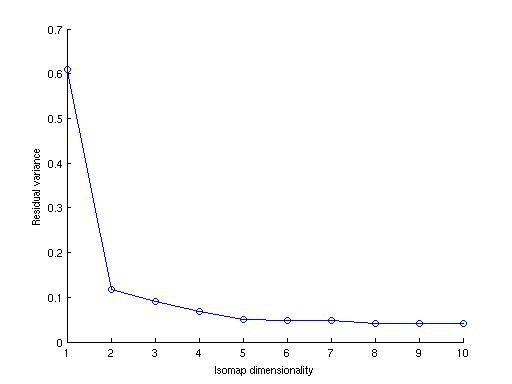
From the residual variance vs dimension plot it can be inferred easily that dimensionality is two because maximum amount of change is occuring during the transition of dimension from 1 to 2. After dimension 2 , the residual variance becomes almost constant which implies that anything is not changing by increasing the dimension after two.
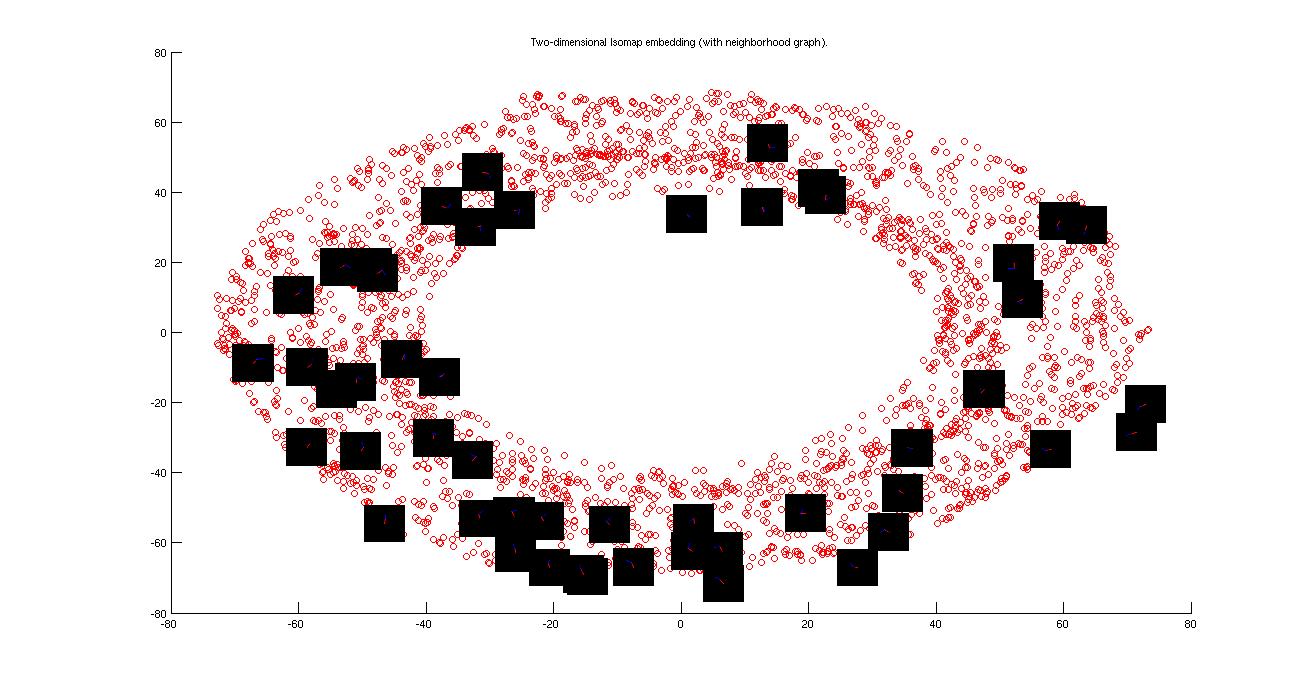
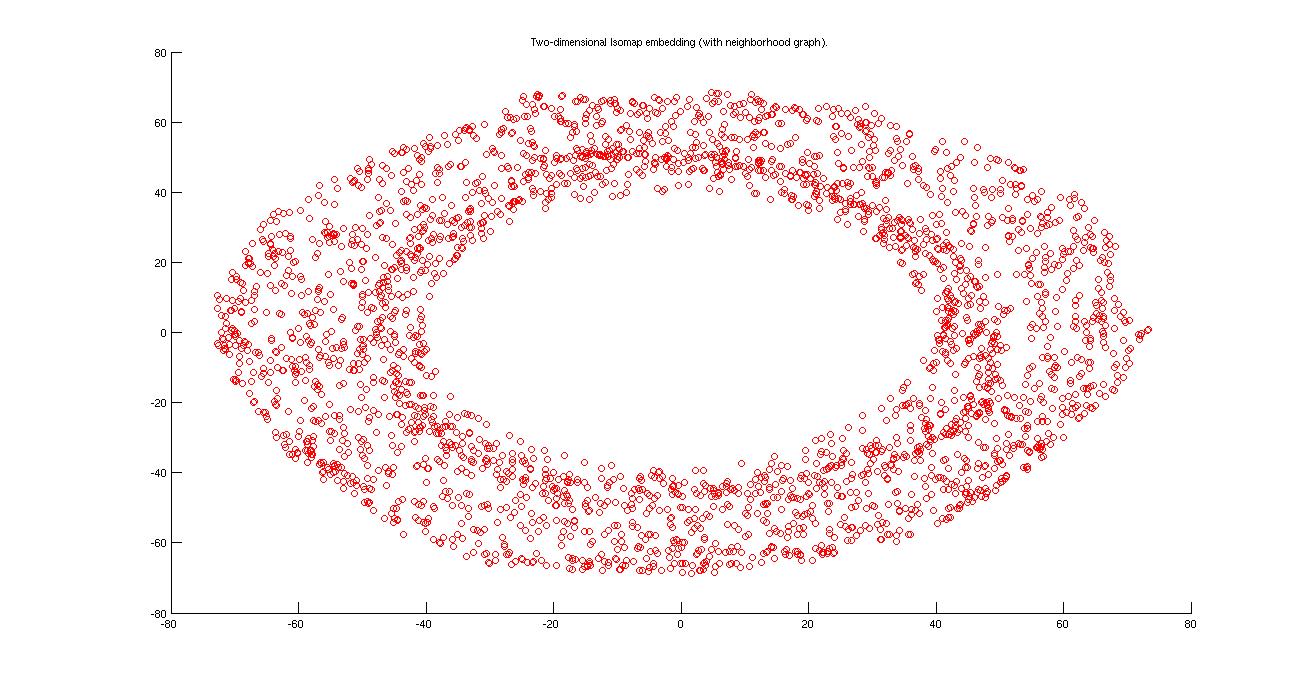
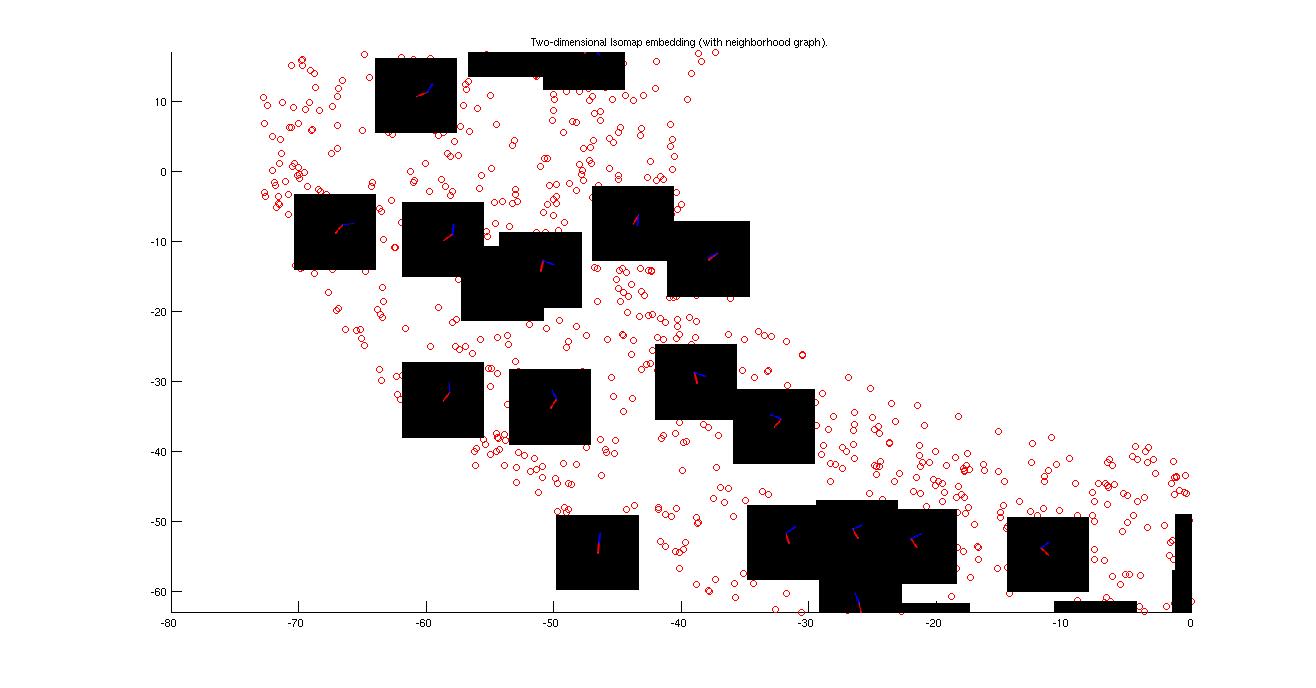
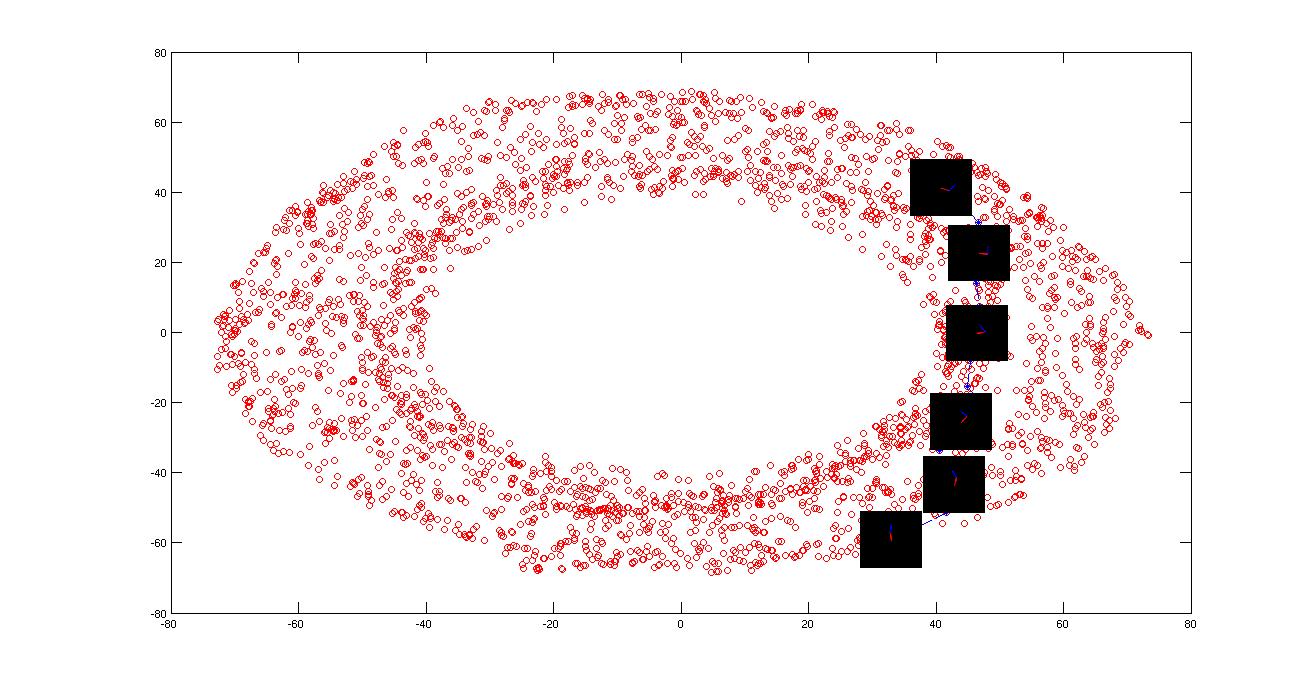
From the isomap plot we can observe that theta one is varying along the larger circle. At the bottom it is around zero and increases upto 6.28 in the clockwise direction. Theta2 varies in the direction of normal to the larger circle (almost in a straight line.)
In the 3 dimension the isomap comes as a toroid

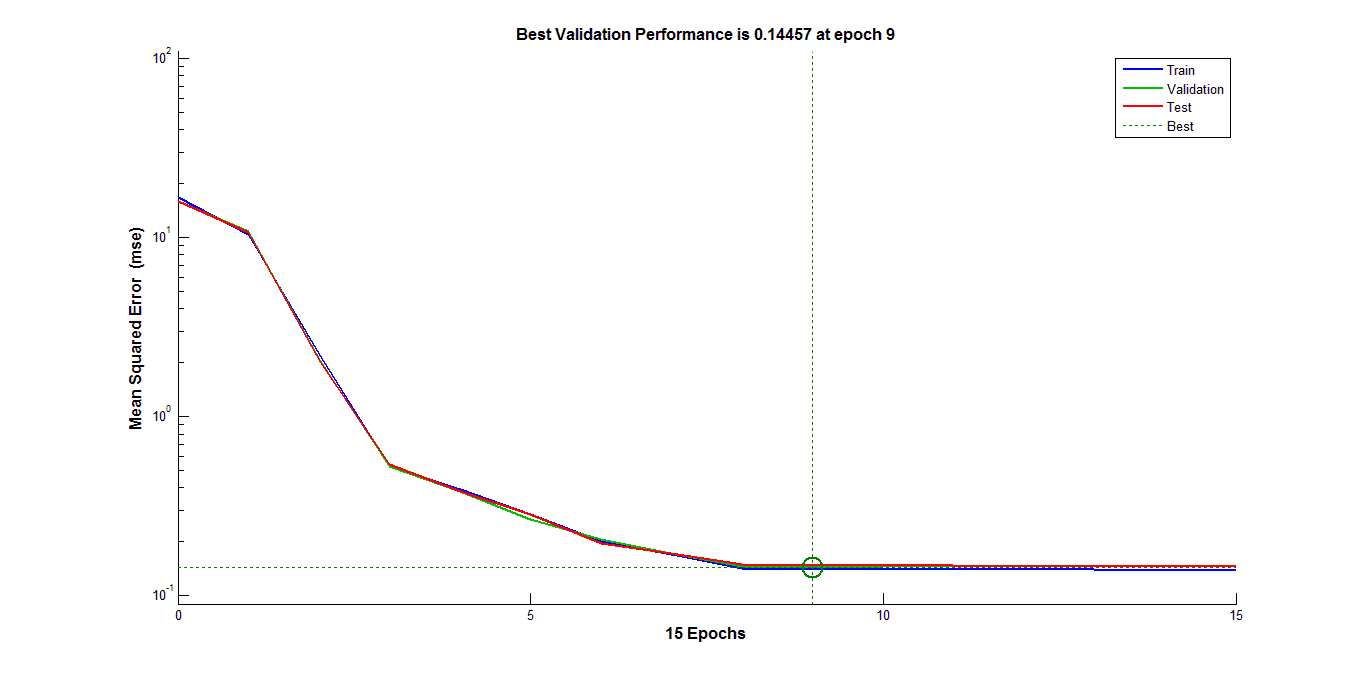
Above is figure for learning from isomap. Learning from isomap is simple and less time consuming than from image. The reason for that is ,the dimension of the input is 2 in the case of learning from isomap image but 30,000 in case of learning from image. 3000 image is good enough training set for two dimensional input but not sufficient for 30,000 dimensional input. So, required no. of epochs is much higher for learning from image.

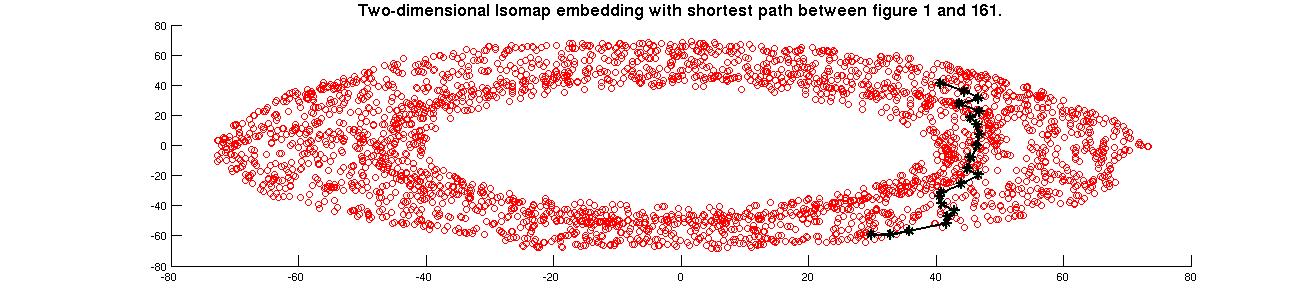
The figure shown below is shortest connecting path betwee 00001.png and 00161.png
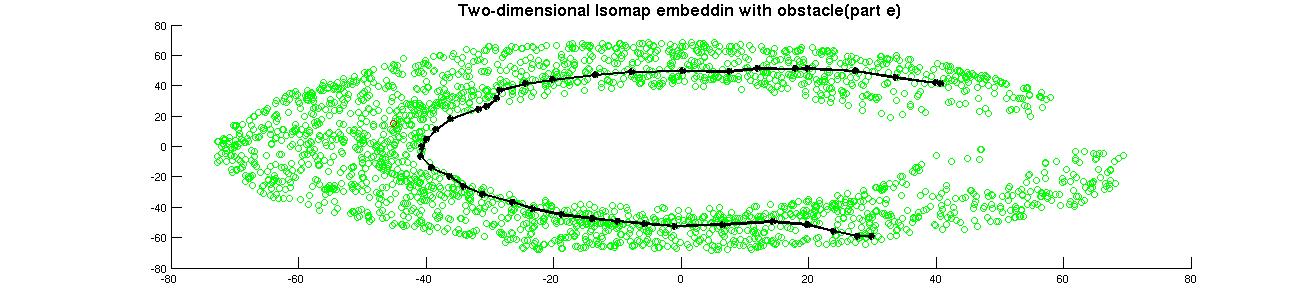

In part E the toroid (circle) is completely cut so the shortest path is through the cylinder but in case of "g" there exist a connetion all over the circle.