ANALYSIS OF THE EFFECT OF SIZE OF RO
ON POSITIONING OF THE LO
The different sizes of the RO that we cosidered here were:
Case 1: 200 units
Case 2: 120 units
Case 3: 80 units
Case 4: 30 units
In the tests run, the RO was a square of variable size
, and the position of its centre was also kept invariant.
The LO was a circle of fixed size.
The tests correspond to a single preposition i.e. right, the only independent
variable was the size of RO.
The dependent variable was the position of the sweet spot.
To see the conclusion, click here.
On performing ANOVA for the Y-Coordinate of the centre of the LO, we obtained the following results :
|
MEAN |
MEAN |
MEAN |
MEAN |
F-RATIO |
|
365 |
355 |
354 |
360 |
0.7051 |
Clustering of the Y-Coordinate positions of the centre of the LO is about 350 which is also the Y-Coordinate of the centre of the RO.
From this table, the value of the F-ratio can be seen
to be 0.7051, which is much less than the maximum acceptable value of F
as calculated from statistical tables.
Also, the means of the Y-Coordinate positions of the center of the LO are
remarkably similar for the four different sizes of the RO.
Thus our NULL HYPOTHESIS that the Y-coordinate of the centre of the LO is independent of the size of the RO is validated.

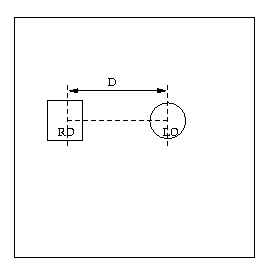
Figure 1: Test Screen
On performing ANOVA for the distance D (see Figure 1) of the centre of the LO from the centre of the RO , which is almost the same as the difference of the X-Coordinates of the centres of the RO and the LO since the Y-Coordinate of the centre of the RO remains almost the same as the Y-Coordinate of the centre of the LO, we obtained the following results :
|
MEAN |
MEAN |
MEAN |
MEAN |
F-RATIO |
|
233 |
200 |
188 |
158 |
3.633 |
We performed linear regression on the above data and calculated the distance between the centre of the LO and the RO (D) as a function of the size of the RO(S). The equation we get is :
D = k + 0.426*S
where k is a constant
From the above result, we conclude that the distance between the centres of the RO and the LO depends on the size of the RO.
Here we observe one more thing. We tabulate the distance D of the centre of the LO from the near boundary of the RO.
|
Size of RO |
200 |
120 |
80 |
30 |
|
D |
132 |
139 |
147 |
143 |
The distance D remains more or less constant. This effect must be studied in detail later.
CONCLUSION
From the above analysis, we can conclude that the distance of the LO from the RO is a function of the size of the RO. An approximate formula to express this dependence has also been computed.