ANALYSIS OF THE EFFECT OF SIZE OF LO
ON POSITIONING OF THE LO
The different sizes of the LO that we cosidered here were:
Case 1: 100 units
Case 2: 75 units
Case 3: 50 units
Case 4: 25 units
In the tests run, the RO was a square of fixed size ,
and the position of its centre was also kept invariant.
The RO was a triangle of varying size.
The tests correspond to a single preposition i.e. right, the only independent
variable was the size of LO.
The dependent variable was the position of the sweet spot.
To see the conclusion, click here.
On performing ANOVA for the Y-Coordinate of the centre of the LO, we obtained the following results :
|
MEAN |
MEAN |
MEAN |
MEAN |
F-RATIO |
|
349 |
345 |
332 |
354 |
1.9623 |
Clustering of the Y-Coordinate positions of the centre of the LO is about 350 which is also the Y-Coordinate of the centre of the RO.
From this table, the value of the F-ratio can be seen
to be 1.9623, which is much less than the maximum acceptable value of F
as calculated from statistical tables.
Also, the means of the Y-Coordinate positions of the center of the LO are
similar for the four different sizes of the LO.
Thus our NULL HYPOTHESIS that the Y-coordinate of the centre of the LO is independent of the size of the RO is validated.
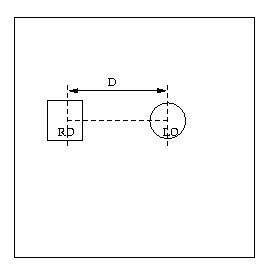
Figure 1: Test Screen
On performing ANOVA for the distance D (see Figure 1) of the centre of the LO from the centre of the RO , which is almost the same as the difference of the X-Coordinates of the centres of the RO and the LO since the Y-Coordinate of the centre of the RO remains almost the same as the Y-Coordinate of the centre of the LO, we obtained the following results :
|
MEAN |
MEAN |
MEAN |
MEAN |
F-RATIO |
|
172 |
187 |
187 |
157 |
0.6781 |
From the table above, we see that the different means are more-or-less clustered together. However, there is no consistent pattern in the way the values of the means change with size of LO. Based on this observation, we feel that the size of the LO should affect the location of the LO. In our case however, there was an extra factor introduced: the largest LO starts from the lower left corner of the screen while the other LO sizes start from the upper right corner of the screen. This introduces a second independent variable into the suite of the tests, over and above the varying size of the LO and this hides any effect that should otherwise have been observed.
CONCLUSION
From the above analysis, we were unable to make any conclusive deductions. We believe that the positioning of the LO will depend on the size of the LO, but were unable to prove it. This factor needs further looking into.