ELLIPTICAL POTENTIAL FIELD PLOTS
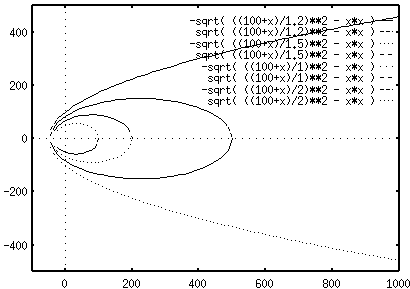
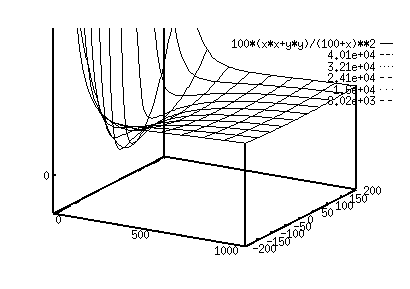
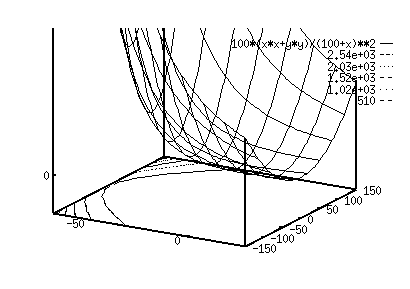
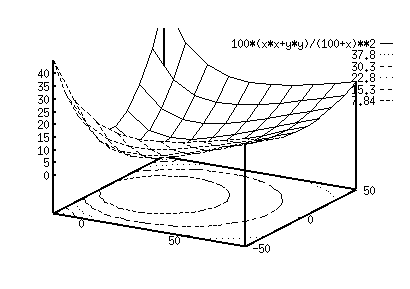
The structure of the field is best illustrated by an example. The edge of the obstacle lies along x= -100 and the sweet spot lies at the point (0,0). For these parameters, various plots are obtained which help us in visualising the field.
The intersection of a plane P which cuts the x-y plane along the line x = -100 with a cone C with vertex at (0,0) is an ellipse or a parabola in 3D plane . If we project this ellipse to the x-y plane we get an ellipse and if we project a parabola to the x-y plane we get a parabola. Thus, by varying the angle between the plane P and the x-y plane a family of ellipses close to the sweet spot (same as vertex of cone C) and parabolas far from the sweet spot are obtained. Given a point (x,y) we can tell on which ellipse/parabola it lies and hence can define a potential for it. We use this method in the spatial positioning program.

Figure 1 : Isopotentials are either closed ellipses or open parabolas which share one focus

Figure 2 : 3D plot of the potential field

Figure 3 : 3D plot of the potential field close to the RO

Figure 4 : 3D plot of the potential field near the sweet spot