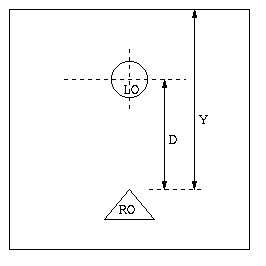
Figure 1 : Test Screen
ANALYSIS OF THE BOUNDARY EFFECTS
ON POSITIONING OF THE LO
The different sizes of the boundaries that we cosidered here were:
Case 1: 700x700 sq. units
Case 2: 600x600 sq. units
Case 3: 500x500 sq.units
Case 4: 400x400 sq. units
In the tests run, the RO was a triangle of fixed size.
The size of the LO was taken to be the same.
We performed the test for two different prepositions:
front and right.
Thus in a particular suite of tests corresponding to a
single preposition ( front or right), the only independent variable was
the size of the boundary.
The dependent variable was the position of the sweet spot.
To see the conclusion, click here.
FRONT
We start off with the assumption that the X-Coordinate of the centre of the LO will not vary as the boundary changes. This can be concluded from our analysis of previous results e.g. shape effects of LO. Even for this suite of tests we have verified this independence but the analysis is not shown here for sake of conciseness.
On performing ANOVA for the Y-Coordinate of the centre of the LO, we obtained the following results :
|
MEAN |
MEAN |
MEAN |
MEAN |
F-RATIO |
|
122 |
101 |
79 |
58 |
3.377 |

Figure 1 : Test Screen
We tabulate the values of D and Y (as defined in Figure 1) for different sizes of the boundaries
| D | 172 | 100 | 78 | 58 |
| Y | 530 | 430 | 330 | 230 |
We performed linear regression on the above data obtained and calculated D as a function of Y.
D = k + 0.216*Y
where k is a constant
From the above result, we conclude that the location of centre of LO depends on the size of the available space Y.
RIGHT
We start off with the assumption that the Y-Coordinate of the centre of the LO will not vary as the boundary changes. This can be concluded from our analysis of previous results e.g. shape effects of LO. Even for this suite of tests we have verified this independence but the analysis is not shown here for sake of conciseness.
On performing ANOVA for the X-Coordinate of the centre of the LO, we obtained the following results :
|
MEAN |
MEAN |
MEAN |
MEAN |
F-RATIO |
|
122 |
113 |
105 |
96 |
0.975 |

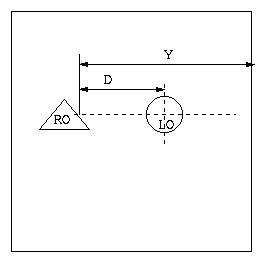
Figure 2 : Test Screen
We tabulate the values of D and Y (as defined in Figure 2) for different sizes of the boundaries
| D |
92 |
83 |
75 |
66 |
|
Y |
570 |
470 |
370 |
270 |
We performed linear regression on the above data obtained and calculated D as a function of Y.
D = k + 0.084*Y
where k is a constant
From the above result, we conclude that the location of centre of LO depends on the size of the available space Y.
Here, the RO is a triangle. We observe that for a triangle, Y-Coordinate of the LO (placed to the right of the RO) corresponds to the mean of the maximum and minimum Y-Coordinates of the triangle rather than to the Y-Coordinate of the centroid of the triangle. This effect must be studied in detail later for polygons of varying shapes and sizes.
From the above analysis, we conclude that the distance of the LO from the RO depends on the available space in the scene ( where available space is defined as above ). We also computed equations expressing the dependency of the final position of the LO on the available space. These dependence equations had different slopes for the two different spatial prepositions considered.