MULTIPLE ROs AND THEIR EFFECT ON THE POSITIONING OF THE LO
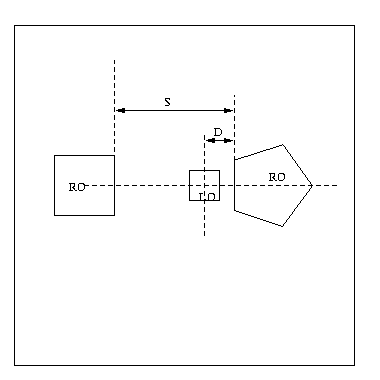
Here, we considered the problem of placing the LO between
2 ROs and near one of them as the distance between
them / their relative size varied.
In case of distance variation, the various
distances between the ROs considered were:
Case 1: 500 units
Case 2: 380 units
Case 3: 260 units
In the tests run, one RO was a square, and the other was
a pentagon, and their sizes were kept the same.
The size of the square LO was taken to be the same over the entire suite
of 3 tests.
In case of the relative size variation, the
different sizes of the pentagon that were considered were:
Case 1: 100 units
Case 2: 75 units
Case 3: 50 units
Case 4: 25 units
The size of the square RO was kept constant at 60 units and the size of the circular LO was also kept fixed over the entire suite of 4 tests.
The dependent variable was the position of the sweet spot.
To see the conclusion, press here.
RELATIVE SIZE VARIATION
We start off with the assumption that the Y-Coordinate of the centre of the LO will not vary as the boundary changes. This can be concluded from our analysis of previous results e.g. shape effects of LO. Even for this suite of tests we have verified this independence but the analysis is not shown here for sake of conciseness.
Applying ANOVA to the X-Coordinates of the center of the LO, we get the following results:
|
MEAN |
MEAN |
MEAN |
MEAN |
F-RATIO |
|
346 |
366 |
386 |
406 |
9.1489 |
The wide difference in the mean values of the X-Coordinates given above, and also the high value of the F-ratio suggest that the X-Coordinate of the center of the LO varies greatly with distance.

We now construct a table between D and S, where D and S are as defined above.
|
D |
74 |
74 |
74 |
74 |
|
S |
260 |
280 |
300 |
320 |
From the table above, and the preceding diagram, it
can be concluded that as the available space between the two ROs changes
(because of the change in size of one of the ROs), the position of the
LO w.r.t. the nearest edge of the RO to which it is 'near' remains almost
exactly constant.
Also, the LO is placed on the line joining the centers of the two ROs.
DISTANCE VARIATION
We start off with the assumption that the Y-Coordinate of the centre of the LO will not vary as the boundary changes. This can be concluded from our analysis of previous results e.g. shape effects of LO. Even for this suite of tests we have verified this independence but the analysis is not shown here for sake of conciseness.
Applying ANOVA to the X-Coordinates of the center of the LO, we get the following results:
|
MEAN |
MEAN |
MEAN |
F-RATIO |
|
446 |
416 |
380 |
14.8993 |
The wide difference in the mean values of the X-Coordinates given above, and also the high value of the F-ratio suggest that the X-Coordinate of the center of the LO varies greatly with distance.
We now construct a table between D and S, where D and S are as defined above, in the section dealing with Relative Sizes of the ROs.
|
D |
106 |
76 |
52 |
|
S |
392 |
272 |
152 |
The data in the table above seemed, to us, to be following
no discernible pattern. Here, the LO appears to be going closer to the
pentagon( which it is described as being nearer to) as the distance between
the 2 ROs increases. The ratio D/S works out to be nearly 0.3 in each of
the 3 cases considered, but we have not been able to come up with a satisfactory
explanation of why this is so.
This effect needs further testing before it can be interpreted.
CONCLUSION
The above analysis gives us a very good result in the case where the available space between the 2 ROs increases as a result of change in size of one of the ROs: the LO is positioned at a constant distance from the RO to which it is supposed to be near. In the case when the ROs move further apart, however, we were unable to explain the results obtained: the distance of the LO from the nearest edge of the 'near' RO was a more-or-less constant factor ( less than 1 ) of the total space available between the two ROs. This observation needs further study.